revenue class 11 economics sandeep garg
revenue class 11 sandeep garg
sandeep garg microeconomics class 11 (2026)
sandeep garg microeconomics class 11 2026-27
revenue class 11 notes
Meaning of Revenue
The amount of money that a producer receives in exchange for the sale proceeds is known as revenue. For example – if a firm gets Rs.16,000 from the sale of 100 chairs, then the amount of Rs.16,000 is known as revenue. Revenue refers to the amount received by a firm the sale of given quantity of a commodity in the market.
Concept of Revenue
- Total Revenue (TR) – Total Revenue refers from the sale of a given quantity of a commodity. It is the total income of a firm. Total revenue is obtained by multiplying the quantity of the commodity sold with the price of the commodity.
Total Revenue = Quantity x Price
For example – If a firm sells 10 chairs at a price of Rs.160 per chair, then the total revenue will be 10 Chairs x Rs.160 = Rs.1,600.
2. Average Revenue (AR) – Average revenue refers to revenue per unit of output sold. It is obtained by dividing the total revenue by the number of units sold.
Average Revenue = Total Revenue /Quantity
For example – If total revenue from the sale of 10 chairs @ Rs.160 per chair is Rs.1,600 then:
Average Revenue = Total Revenue / Quantity
= 1600/10
= Rs.160
3. Marginal Revenue (MR) – Marginal revenue is the additional revenue generated from the sale of an additional unit of output. It is the change in TR from the sale of one more unit of a commodity.
MRn = TRn – TRn-1
Where:
MRn = Marginal Revenue of nth unit;
TRn = Total revenue from n units;
TRn-1 = Total revenue from (n – 1) units;
n = Number of units sold
for example – if the total revenue realised from sale of 10 chairs is Rs.1,600 and that from the sale of 11 chairs is Rs.1,780, then the MR of the 11th chair will be:
MR11 = TR11 – TR10
MR11 = Rs.1,780 – Rs.1,600
= Rs.180
Relationship Between Revenue Concepts
The relationship between different revenue concepts can be discussed under two situations:
- When Price remains Constant – It happens under Perfect competitions. In this situation, firm has to accept the same price as determined by the industry. It means, any quantity of a commodity can be sold at that particular price.
- When Price Falls with a rise in output – It happens under Imperfect Competition. In this situation, the firm follows its own pricing policy. However, it can increase sales only by reducing the price.
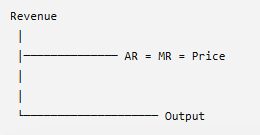
Relationship between AR and MR (When Price remains Constant) – when price remains same at all output levels (like in case of perfect competition), no firm is in a position to influence the market price of the product. A firm can sell more quantity of output at the same price. It means, the revenue from every additional unit (MR) is equal to AR. As a result, both AR and MR curves coincide in a horizontal straight line parallel to the X-axis.
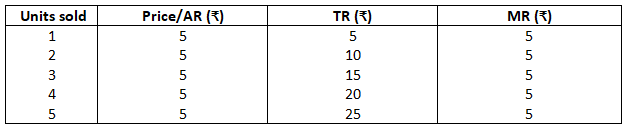
Relationship between TR and MR (When Price remains Constant) – When price remains constant, firms can sell any quantity of output at the price fixed by the market. As a result, MR curve (and AR curve) is a horizontal straight line parallel to the X-axis. Since MR remains constant, TR also increases at a constant rate. Due to this reason, the TR curve is a positively sloped straight line. As TR is zero at zero level of output, the TR curve starts from the origin.
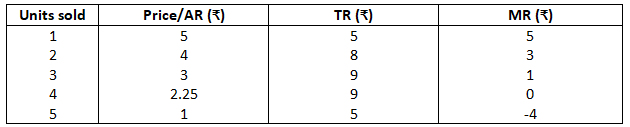
Relationship between AR and MR (when price falls with rise in output) – When firms can increase their volume of sales only by decreasing the price, i.e. under imperfect competition, then AR falls with increase in sale. It means, revenue from every additional unit will be less than AR. As a result, both AR and MR curves slope downwards from left to right.
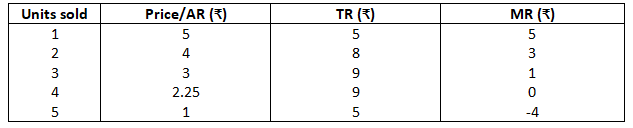
General Relationship between AR and MR – The relationship between AR and MR depends on whether the price remains the same or falls with a rise in output. However, if nothing is mentioned about the nature of price with a rise in output, then the following general relation exists between AR and MR:
- AR increases as long as MR is higher than AR (or when MR > AR, AR increases).
- AR is maximum and constant when MR is equal to AR (or when MR = AR, AR is maximum).
- AR falls when MR is less than AR (or when MR < AR, AR falls).
Relationship between TR and MR (When Price Falls with rise in output) – when more of output can be sold only by lowering the price, then revenue from every additional unit (i.e. MR) will fall. MR is the addition to TR when one more unit of output is sold. So, TR will increase when MR is positive, TR will fall when MR is negative and TR will be maximum whe MR is zero.
Short Answer Type Questions
- Explain the relationship between marginal revenue and average revenue when a firm is able to sell more quantity of output: (i) at the same price. (ii) only by lowering the price.
Answer:
(i) at the same price – When a firm sells all units of output at the same price, the market is perfectly competitive.
- Average Revenue (AR) remains constant because every unit is sold at the same price.
- Marginal Revenue (MR) is also equal to the price received from selling one additional unit.
- Therefore,
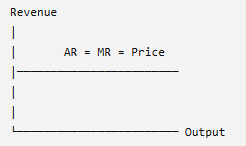
AR = MR = Price
Example:

(ii) only by lowering the price – When a firm can sell more output only by reducing the price, the market is imperfectly competitive.
- Average Revenue falls because the selling price decreases.
- Marginal Revenue falls more rapidly than Average Revenue.
- Therefore,
MR < AR

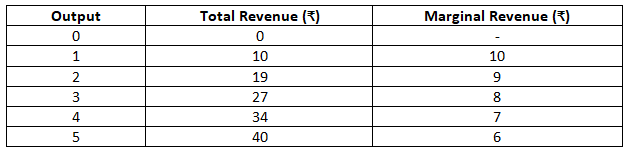
2. Explain the relationship between total revenue and marginal revenue with the help of a revenue schedule.
Answer:
Marginal Revenue (MR) is the addition made to Total Revenue (TR) when one more unit of output is sold.
MR = Change in TR / Change in Output
Revenue Schedule
Relationship:
- When MR is positive, Total Revenue increases.
- When MR decreases but remains positive, Total Revenue increases at a diminishing rate.
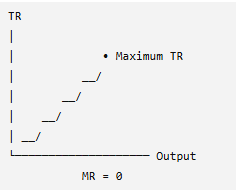
- When MR becomes zero, Total Revenue reaches its maximum.
- When MR becomes negative, Total Revenue starts decreasing.
3. What change in total revenue will result in (i) a decrease in marginal revenue, and (ii) an increase in marginal revenue?
Answer:
(i) A decrease in marginal revenue – Marginal Revenue decreases when Total Revenue continues to increase but at a decreasing rate.
Example:
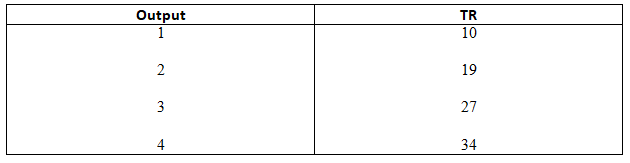
Increase in TR = 10, 9, 8, 7
(ii) An increase in Marginal Revenue – Marginal Revenue increases when Total Revenue increases at an increasing rate.
Example:
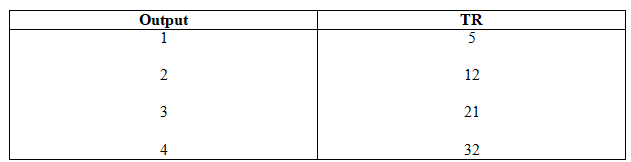
Increase in TR = 5, 7, 9, 11
4. How do changes in marginal revenue affect total revenue?
Answer:
There is a direct relationship between Marginal Revenue and Total Revenue.
- When MR is positive, Total Revenue increases.
- When MR is positive but decreasing, Total Revenue increases at a diminishing rate.
- When MR becomes zero, Total Revenue is maximum.
- When MR becomes negative, Total Revenue starts decreasing.
5. What is revenue of a firm? Give meaning of average revenue and marginal revenue. What happens to average revenue when marginal revenue is: (i) Greater than average revenue; (ii) Equal to average revenue; (iii) Less than average revenue?
Answer:
Revenue – Revenue is the money received by a firm from the sale of goods and services during a given period.
Average Revenue (AR) – Average Revenue is the revenue earned per unit of output sold.
AR = Total Revenue / Quantity Sold
Marginal Revenue (MR) – Marginal Revenue is the additional revenue earned by selling one more unit of output.
MR = Change in Total Revenue / Change in Quantity
Relationship between MR and AR
(i) When MR > AR – Average Revenue increases because the additional unit earns more revenue than the current average.
(ii) When MR = AR – Average Revenue remains constant because the additional revenue equals the existing average.
(iii) When MR < AR – Average Revenue decreases because the additional unit earns less revenue than the existing average.
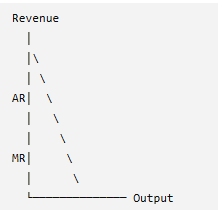
6. Draw average revenue and marginal revenue curves in a single diagram of a firm which can sell more units of a good only by lowering the price of that good. Explain.
Answer: When a firm can sell more units only by reducing the price, it operates under imperfect competition.
- Both Average Revenue (AR) and Marginal Revenue (MR) slope downward from left to right.
- The MR curve lies below the AR curve because the price reduction applies to all units sold.
- MR falls faster than AR.
7. Draw in a single diagram the average revenue and marginal revenue curves of a firm which can sell any quantity of the good at a given price. Explain.
Answer: A firm selling any quantity at a given price operates under perfect competition.
- Price remains constant.
- Average Revenue (AR) = Marginal Revenue (MR) = Price.
- Both AR and MR are represented by the same horizontal straight line.
8. State the relation between marginal revenue and average revenue.
Answer: The relationship between Marginal Revenue (MR) and Average Revenue (AR) is:
- Under perfect competition, MR = AR.
- Under imperfect competition, MR is always less than AR (MR < AR).
- Both AR and MR fall as output increases, but MR falls more rapidly.
9. Why is Average Revenue always equal to price?
Answer:
Average Revenue is calculated as:
AR = Total Revenue ÷ Quantity Sold
Total Revenue = Price × Quantity
AR = (Price × Quantity) ÷ Quantity = Price
10. “Demand curve is the Average Revenue (AR) curve of a firm.” Do you agree? Discuss briefly, with reason in support of your answer.
Answer:
Yes, I agree.
The demand curve of a firm shows the quantity that can be sold at different prices. Average Revenue is equal to the price received per unit, every point on the demand curve also represents Average Revenue.
Reason:
AR = Price, and the demand curve shows the relationship between price and quantity demanded. Hence, both are the same curve.
Long Answer type Questions
- Explain the relationship between total revenue and marginal revenue with the help of a diagram.
Answer: Total Revenue (TR) – Total Revenue refers to the total receipts received by a firm from the sale of goods.
TR = Price × Quantity
Marginal Revenue (MR)- Marginal Revenue refers to the additional revenue earned by selling one more unit of output.
MR = Change in TR / Change in Quantity
The relationship between TR and MR is explained below:
- When MR is positive: Total Revenue increases because every additional unit adds something to total revenue.
- When MR is zero: Total Revenue becomes maximum because the sale of an additional unit does not increase revenue.
- When MR is negative: Total Revenue starts declining because an additional unit reduces total revenue.
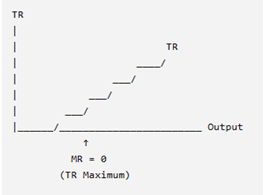
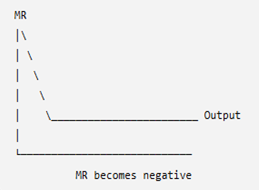
- TR curve rises when MR is positive.
- TR reaches maximum when MR = 0.
- TR falls when MR becomes negative.
- MR curve cuts the X-axis at the point where TR is maximum.
2. Discuss the relationship between AR and MR when: (i) Price remains constant; (ii) Price falls with rise in output.
Answer –
(i) When Price remains constant: Under perfect competition, price remains constant at all levels of output.
- AR remains constant.
- MR is also constant.
- Therefore, AR = MR = Price.
(ii) When Price falls with rise in output: Under imperfect competition, a firm can sell more output only by reducing price.
- AR curve slopes downward.
- MR curve also slopes downward.
- MR falls faster than AR.
- Therefore, MR < AR.
3. Briefly discuss the shapes of TR, AR and MR curves with the help of an imaginary schedule and diagram (when price remains same).
Answer: When price remains constant, the firm is operating under perfect competition.
Shape of Curves:
- TR Curve: TR increases at a constant rate because each unit is sold at the same price. Hence, TR curve is an upward sloping straight line.
- AR Curve: AR remains constant as price does not change. Therefore, AR curve is a horizontal straight line.
- MR Curve: MR also remains constant and equal to AR. Hence, MR curve is also a horizontal line.
4. What is the relationship between: (a) Marginal Revenue and Average Revenue; (b) Total Revenue and Marginal Revenue.
Answer:
(a) Relationship between MR and AR:
- Under perfect competition, price remains constant, so AR = MR.
- Under imperfect competition, both AR and MR fall with increase in output.
- MR falls faster than AR and remains below AR.
(b) Relationship between TR and MR:
- When MR is positive, TR increases.
- When MR is zero, TR is maximum.
- When MR is negative, TR decreases.
5. What is revenue in microeconomics? State the relation between marginal revenue and average revenue under perfect competition using suitable diagram or schedule.
Answer: Revenue refers to the income earned by a firm from selling its output.
There are three types of revenue:
- Total Revenue (TR): Total income from sale of output.
- Average Revenue (AR): Revenue per unit of output.
- Marginal Revenue (MR): Addition to total revenue by selling one more unit.
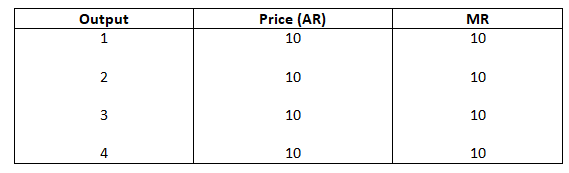
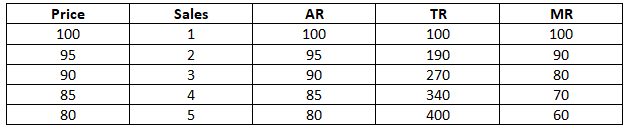
Under perfect competition, a firm is a price taker and sells all units at the same price.
- AR remains constant.
- MR remains constant.
- AR = MR = Price
Schedule
UNSOLVED PRACTICALS’
- Calculate TR, AR and MR.

Solution –

2. Determine the values of TR, AR and MR from the following data:

Solution –
3. Compute TR, AR and MR.

Solution –

4. With the help of the given data, calculate the values of TR, AR and MR.

Solution –
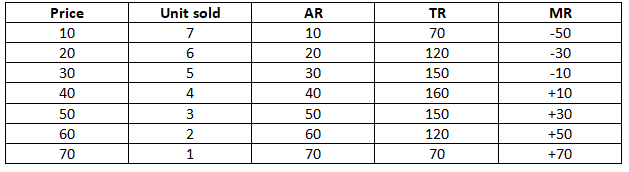
5. From the following data, determine TR, AR and MR.

Solution –
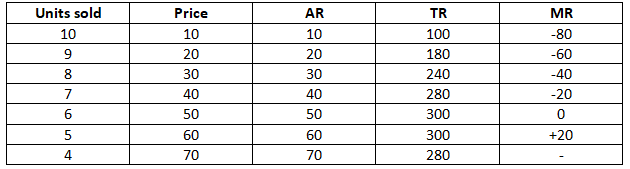
6. Determine AR and MR.

Solution –
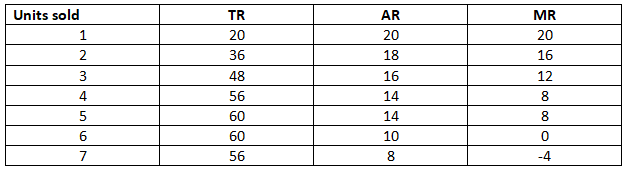
7. Estimate the value of TR and MR.

Solution –

8. Calculate TR and MR from the following data:

Solution –
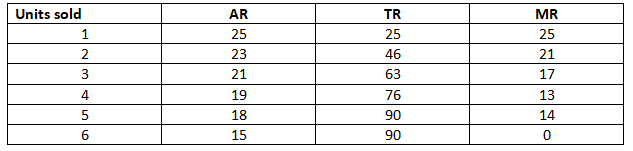
9. Complete the following table:

Solution –
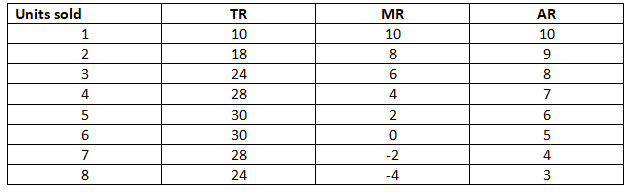
10. Complete the following table:

Solution –

11. Complete the following table:

Solution –

12. Calculate TR and AR.

Solution –
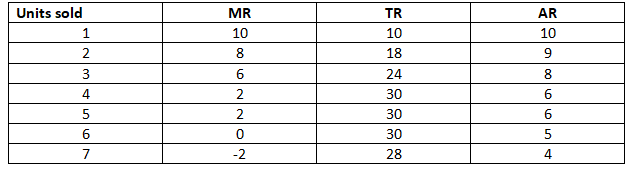
13. Complete the following tables:

Solution –
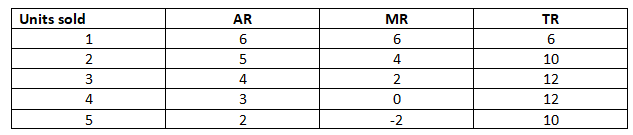
14. From the information given below, calculate the values of TR and MR.

Solution –
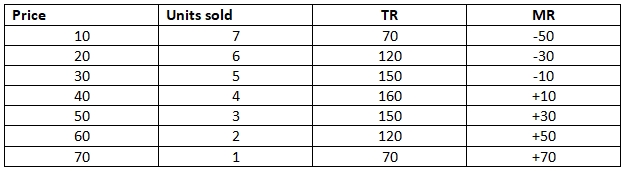
15. Complete the following table:

Solution –

16. The MR schedule of a monopoly firm is given below. Derive the TR and AR schedules.

Solution –
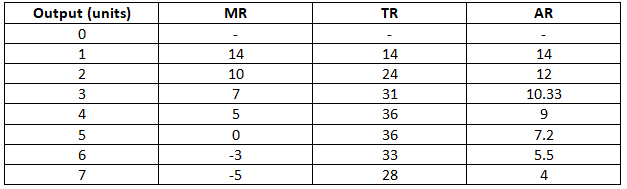
17. Complete the following table:

Solution –

18. Complete the following table:

Solution –
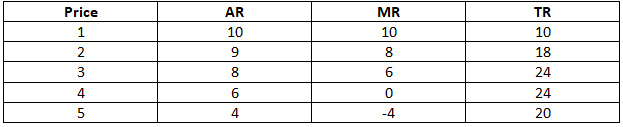
19. Complete the following table:

Solution –

20. A shopkeeper sold 25 calculators at the price of Rs.125 each. His total receipts increased to Rs.3,380 after selling 26 calculators. At what price did he sell the 26th calculator?
Solution –

Price of 26th calculator = 3380/26
= Rs.130
21. When sale of a unit increased from 20 unit to 35 units, the total revenue increased by Rs.1,200. Calculate marginal revenue.
Solution –
Given –
ΔTR = Rs.1200
Q = 20 units
Q1 = 35 units
i.e.,
ΔQ = 35 – 20
= 15 units
MR = ΔTR/ ΔQ
= 1200/15
= Rs.80
NCERT