class 11 microeconomics cost notes
class 11 economics cost notes pdf
cost chapter in economics class 11 pdf
cost chapter in economics class 11 pdf sandeep garg
Meaning of Cost
Cost is the total expenditure incurred in producing a commodity. In Economics, Cost in the sum total of:
- Explicit Cost – It is the actual money expenditure on inputs or payments made to outside for hiring their factor services. For example – wages paid to the employees, rent paid for hired premises, payment for raw material, etc.
- Implicit Cost – It is the estimated value of the inputs supplied by the owners including normal profit. For example – estimated interest on own capital, estimated rent of own land, imputed salary for the services of entrepreneur, etc. such costs are the costs of self supplies factors.
Cost Function – The relation between cost and output is known as ‘Cost function’. Cost function refers to the functional relationship between cost and output.
It is expressed as: C = f(q)
(Where: C = cost of production; q = Quantity of output; f = Functional relationship)
Opportunity cost – Opportunity cost is cost of the next best alternative foregone. The concept of opportunity cost is very important as it forms the basis of the concept of cost. When a firm decides to produce a particular commodity, then it always considers the value of the alternative commodity, which is not produced. The value of the alternative commodity is the opportunity cost of the good that the firm is now producing. For example – suppose, a farmer can produce either 50 quintals of rice or 40 quintals of wheat on his land with the given resources. If he chooses to produce rice, then he will have to forego the opportunity of producing 40 quintals of wheat.
Short Run Costs
We know, in the short run, there are some factors which are fixed, while others are variable. Similarly, short run costs are also divided into two kinds of costs:
- Fixed Costs
- Variable Cost
The sum total of fixed cost and variable cost is equal to total cost.
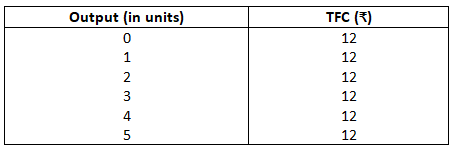
Total Fixed Cost (TFC) or Fixed Cost (FC) – Fixed costs refer to those costs which do not vary directly with the level of output. For example – rent of premises, interest on loans, salary of permanent staff, insurance premium, etc. Fixed cost is incurred on fixed factors like machinery, land, building, etc., which cannot be changed in the short run. The payment to these factors remains fixed irrespective of the level of output i.e. fixed cost remains the same, whether output is large, small or even zero.
Total Fixed Cost Schedule
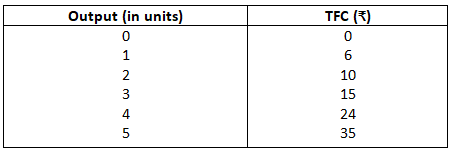
Total Variable Cost (TVC) or Variable cost (VC) – Variable costs refer to those costs which directly with the level of output. For example – payment for raw materials, power, fuel, wages of casual labour, etc. Variable costs are incurred on variable factors like raw material, direct labour, power, etc. which changes with change in level of output. It means, variable costs rise with the increase in the output and fall with a decrease in the output. Such cost are incurred till there is production and become zero level of output.
Total Variable Cost Schedule
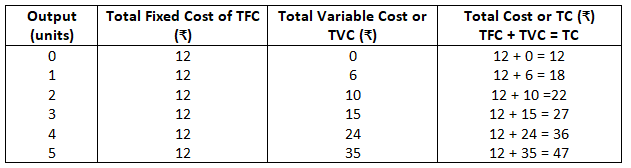
Total Cost (TC) – Total cost (TC) is the total expenditure incurred by a firm on the factors of production required for the production of a commodity. TC is the sum of total fixed cost (TFC) and total variable cost (TVC) at various level of output.
TC = TFC + TVC
Since TFC remains the same at all levels of output, the change in TC is entirely due to TVC. The concept to total cost can be better understood.
Total Cost Schedule
Relationship between TC, TFC and TVC
The various points of relationship between TC, TFC and TVC can be better explained with the help.
- TFC curve is a horizontal straight line parallel to X-axis as it remains constant at all levels of output.
- TC and TVC curves are inversely S-shaped because they rise initially at a decreasing rate, then at a constant rate and finally, at an increasing rate. The reason behind their shape is the Law of Variable Proportions.
- At zero output, TC is equal to TFC because there is no variable cost at zero level of output. So, TC an TFC curves start from the same point, which is above the origin.
- The vertical distance between TFC curve and TC curve is equal to TVC. As TVC rises with increase in the output, the distance between TFC and TC curves also goes on increasing.
- TC and TVC curves are parallel to each other and the vertical distance between them remains the same at all levels of output because the gap between them represents TFC, which remains constant at all levels of output.
Average Costs
The per unit costs explain the relationship between cost and output in a more realistic manner. From total fixed cost (TFC), total variable cost (TVC) and total cost (TC), we can obtain per unit costs. The 3 kinds of ‘per unit costs’ are:
- Average fixed Cost (AFC) – Average fixed cost refers to the per unit fixed cost of production. It is calculated by dividing TFC by total output.
AFC = TFC ÷ Q
(where AFC = Average fixed cost; TFC = total fixed cost; Q = Quantity of output)
AFC falls with an increase in output as TFC remains the same at all levels of output.
2. Average Variable Cost (AVC) – Average variable cost refers to the per unit variable cost of production. It is calculated by dividing TVC by total output.
AVC = TVC ÷ Q
(where: AVC = Average variable cost; TVC = Total Variable Cost; Q = Quantity of output)
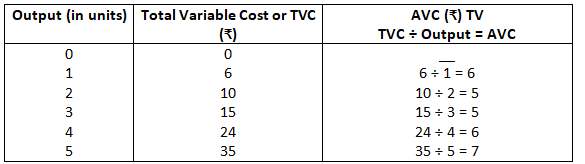
AVC initially falls with increase in output and after reaching its minimum level of Rs.5, it starts rising.
3. Average Total Cost (ATC) or Average Cost (AC) – Average cost refers to the per unit total cost of production. It is calculated by dividing TC by total output.
AC = TC ÷ Q
(Where: AC = Average cost; TC = Total cost; Q = Quantity of output)
Average cost is also defined as the sum of average fixed cost (AFC) and average variable cost (AVC), i.e. AC = AFC + AVC
Importance Observations: AC, AVC and AFC
- AC curve will always lie above the AVC curve because AC, all levels of output includes both AVC and AFC.
- AVC reaches its minimum point (point ‘B’) at a level of output lower than that of AC (point ‘A’) because when AVC is at its minimum point, AC is still falling because of falling AFC.
- As the output increases, the gap between AC and AVC curves decrease, but, they never intersect each other. It happens because the vertical distance between them is AFC, which can never be zero.
Marginal Cost (MC)
Marginal cost refers to addition to total cost when one more unit of output is produced. For example – if TC of producing 2 units is Rs.200 and TC of producing 3 units is Rs.240,
then MC = 240 – 200 = Rs.40.
MCn = TCn – TCn-1
Where:
n = Number of units produced
MCn = Marginal cost of the nth unit
TCn = total cost of n units
TCn-1 = total cost of (n – 1) units.
Relationship Between Short Run cost Curves
As discussed earlier, there exists a close relationship between the various types of costs. Let us understand the relationship between the following costs:
- Average Cost (AC) and Marginal Cost (MC)
- Average Variable Cost (AVC) and Marginal Cost (MC)
- Average Cost (AC) and Average Variable Cost (AVC) and Marginal Cost (MC)
- Average Cost (AC) and Average Variable Cost (AVC)
- Total Cost (AC) and Marginal Cost (MC)
- Total Variable Cost (TVC) and Marginal Cost (MC).
- Relationship between AC and MC – There exists a close relationship between AC and MC.
- Both AC and MC are derived from total cost (TC). AC refers to TC per unit of output and MC refers to addition to TC when one more unit of output is produced.
- Both AC and MC curves are U-shaped due to the Law of Variable Proportions.
AC depends on the nature of MC – between AC and MC, it is MC that brings changes in AC and not the other way round. So, when MC falls, it pulls AC down and when MC rises, it pulls AC up.
- When MC curve lies below the AC curve, it pulls the latter downwards;
- When MC curve lies above AC curve, it pulls the latter upwards;
- Consequently, MC and AC are equal where MC intersects AC curve.
Can AC fall, when MC is rising? – Yes, AC can fall, when MC is rising. However, this is only possible when MC is less then AC. It means that as long as MC curve is below the AC curve, AC will fall even if MC is rising.
Can AC rise, when MC is falling? – No, AC cannot rise, when MC is falling because when MC falls, AC will also fall.
2. Relationship between AVC and MC – The relationship between AVC and MC curves is similar to that of AC and MC.
- Both AVC and MC are derived from total variable cost (TVC). AVC refers to TVC per unit of output and MC is the addition to TVC, when one more unit of output is produced.
- Both AVC and MC curves are U-shaped due to the Law of Variable Proportions.
3. Relationship between AC, AVC and MC – The relationship between AC, AVC and MC can be better illustrated with the help of following schedules and diagram.
- When MC is less than AC and AVC, both of them fall with increase in the output.
- When MC becomes equal to AC and AVC, they become constant. MC curve cuts AC curve (at ’A’) and AVC curve (at ‘B’) at their minimum points.
- When MC is more than AC and AVC, both rise with increase in output.
4. Relationship between AC and AVC – The relationship between AC and AVC can be discussed with the help of
- AC is greater than AVC by the amount of AFC.
- The vertical distance between AC and AVC curves continues to fall with increase in output because the gap between them is AFC, which continues to decline with rise in output.
- AC and AVC curves never intersect each other as AFC can never be zero.
- Both AC and AVC curves are U-shaped due to the Law of Variable Proportions.
- MC curve cuts AVC and AC curves at their minimum points.
- The minimum point of AC curve (point A) always lies to the right of the minimum point of AVC curve (point B).
5. Relationship between TC and MC – The main points of relationship between TC and MC are:
- Marginal Cost is the addition to Total Cost, when one more unit of output is produced. MC is calculated as:
MCn = TCn – TCn-1
- When TC rises at a diminishing rate, MC declines.
- At point Q, TC stops increasing at a decreasing rate because MC is at its minimum point, i.e. point E.
- Beyond point Q, TC is increasing at an increasing rate because MC is increasing.
6. Relationship between TVC and MC – We know, MC is addition to TVC when one more unit of output is produced. So, TVC can be obtained as a summation of MC’s of all the units produced. It the output is assumed to be perfectly divisible, then the total area under the MC curve will be equal to TVC.
Short Answer Type Questions
- Giving examples, explain the meaning of cost in economics.
Answer: In economics, cost means the expenditure incurred by a producer on the use of various resources to produce a good or service. It includes both the money actually paid for resources and the value of resources owned by the producer.
Examples:
- Payment of wages to workers.
- Rent of a factory building.
- Cost of raw materials.
- Interest paid on borrowed capital.
2. Explain, in brief, the meaning of opportunity cost.
Answer:
Opportunity cost is the value of the next best alternative that is sacrificed when a particular choice is made. In other words, when scarce resources are used for one purpose, the benefit from the next best alternative is forgone. This sacrificed benefit is called opportunity cost.
Example: Suppose a farmer can grow either wheat or rice on the same land. If he chooses to grow wheat, the income he could have earned from growing rice is the opportunity cost of producing wheat.
3. State the distinction between explicit cost and implicit cost. Give an example of each.
Answer –
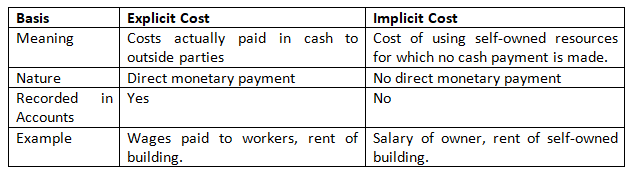
Examples:
- Explicit Cost: Payment of electricity bill.
- Implicit Cost: Interest on the owner’s own capital used in the business.
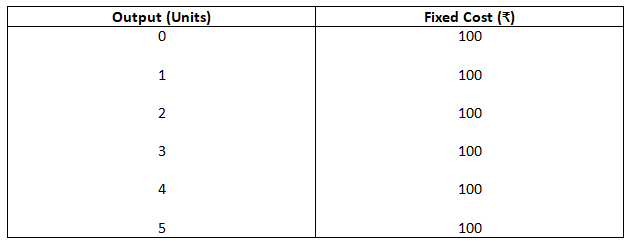
4. What is the meaning of fixed cost? Draw a fixed cost curve with the help of an imaginary schedule. Also, given two examples of fixed cost.
Answer: Fixed Cost (FC) refers to those costs which remain constant irrespective of the level of output in the short run. These costs have to be incurred even when production is zero.
Imaginary Schedule
Fixed cost curve
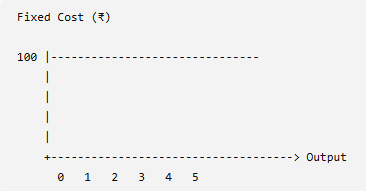
The Fixed Cost Curve is a horizontal straight line because fixed cost remains the same at all levels of output.
Examples of Fixed Cost:
- Rent of factory building.
- Salary of permanent manager.
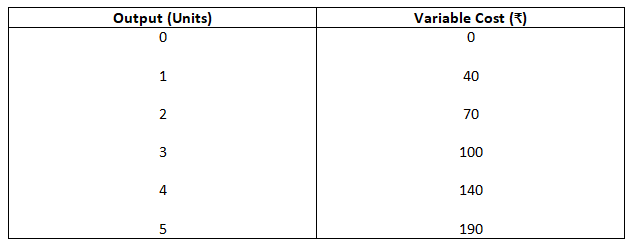
5. Explain, in brief, the meaning of variable cost with the help of a hypothetical schedule and diagram.
Answer: Variable Cost (VC) refers to those costs which change with the level of output. As production increases, variable cost increases, and when production is zero, variable cost is also zero.
Hypothetical Schedule
Variable cost Curve
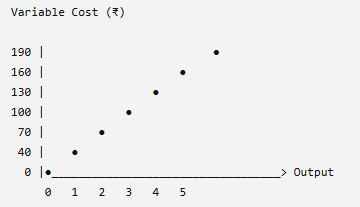
The Variable Cost Curve slopes upward from the origin, showing that variable cost increases as output increases.
Examples of Variable Cost:
- Cost of raw materials.
- Wages paid to casual labour.
6. Distinguish between fixed cost and variable costs. Give two examples of each.
Answer –
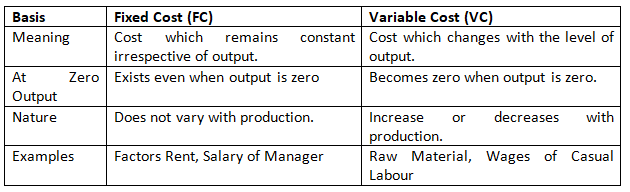
7. Define average fixed cost(AFC). Discuss the shape of AFC curve with the help of a schedule and a diagram.
Answer:
Average Fixed Cost (AFC) is the fixed cost per unit of output.
AFC = FC ÷ Output
Schedule
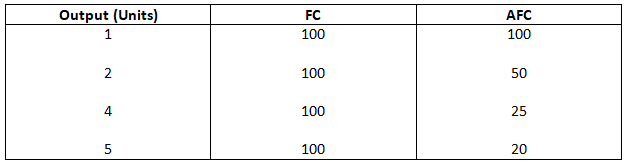
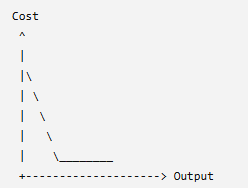
Shape of AFC Curve:
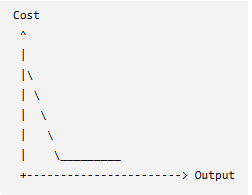
- AFC falls continuously as output increases.
- It is a downward sloping rectangular hyperbola because fixed cost is spread over more units.
8. What is meant by average variable cost (AVC)? Why is AVC curve U – Shaped?
Answer: Average Variable Cost (AVC) is the variable cost per unit of output.
AVC = TVC ÷ Output
AVC curve is U-shaped because:
- Initially, AVC falls due to increasing returns to a factor.
- After a certain level of output, AVC rises due to diminishing returns to a factor.
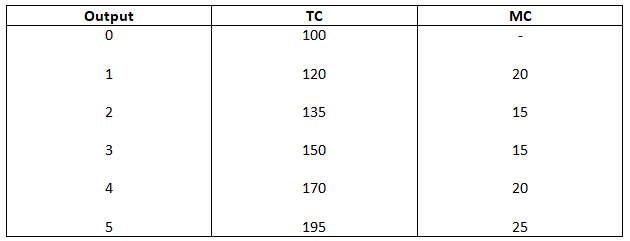
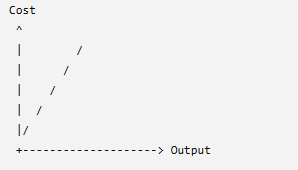
9. Explain the concept of marginal cost with the help of a hypothetical schedule and diagram.
Answer: Marginal Cost (MC) is the additional cost incurred in producing one more unit of output.
MC = Change in TC ÷ Change in Output
Schedule
10. Why does the vertical distance between AC curve and AVC curve gradually decline?
Answer: The vertical distance between AC and AVC curves is equal to Average Fixed Cost (AFC). As output increases, AFC continuously falls because the same fixed cost is spread over more units. Therefore, the vertical distance between AC and AVC curves gradually declines.
11. What is the relationship between marginal cost and average variable cost?
Answer:
- When MC is less than AVC, AVC falls.
- When MC is equal to AVC, AVC is minimum.
- When MC is greater than AVC, AVC rises.
12. Explain the relation between marginal cost and average cost.
Answer:
- When MC is less than AC, AC falls.
- When MC is equal to AC, AC is minimum.
- When MC is greater than AC, AC rises.
13. Draw average total cost, average variable cost and marginal cost curves in a single diagram. Also, explain the relationship between ATC and AVC.
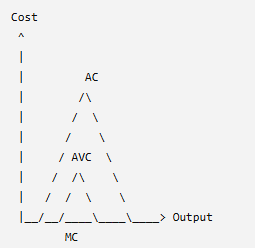
Relationship between ATC and AVC:
- ATC is always greater than AVC.
- The difference between ATC and AVC is AFC.
- As output increases, AFC falls, so the gap between ATC and AVC becomes smaller.
14. State the relation between total cost and marginal cost.
Answer:
- Marginal Cost is the change in Total Cost due to the production of one additional unit of output.
- When MC falls, TC increases at a decreasing rate.
- When MC rises, TC increases at an increasing rate.
- Thus, MC shows the rate of change in Total Cost.
15. Discuss the relationship between TVC and MC.
Answer:
- Marginal Cost is the change in Total Variable Cost resulting from producing one additional unit of output.
- MC is calculated from TVC because Fixed Cost remains constant.
- When TVC increases at a decreasing rate, MC falls.
- When TVC increases at an increasing rate, MC rises.
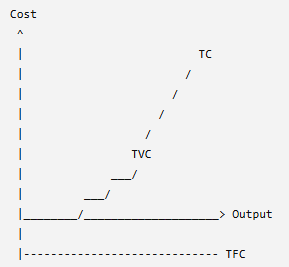
16. State the behavior of Total Variable Cost. Draw Total Variable Cost, Total Cost and Total Fixed Cost Curves in a single diagram.
Answer:
Behaviour of Total Variable Cost (TVC):
- TVC is zero when output is zero.
- TVC increases with increase in output.
- Initially, it increases at a decreasing rate due to increasing returns.
- Later, it increases at an increasing rate due to diminishing returns.
17. Why is the Total Fixed Cost Curve parallel to the horizontal axis (x-axis)?
Answer: The Total Fixed Cost (TFC) curve is parallel to the horizontal axis because fixed costs remain constant at all levels of output. Whether production is zero or maximum, Total Fixed Cost does not change in the short run.
18. What is the behavior of average fixed cost as output is increased? Why is it so?
Answer: Average Fixed Cost (AFC) continuously decreases as output increases. This is because the same fixed cost is distributed over a larger number of units. Therefore, AFC keeps falling but never becomes zero.
19. Define cost. State the relation between marginal cost and average variable cost.
Answer: Cost is the expenditure incurred by a producer on the use of factors of production to produce goods and services.
Relation between MC and AVC:
- When MC is less than AVC, AVC falls.
- When MC is equal to AVC, AVC is minimum.
- When MC is greater than AVC, AVC rises.
20. What is the behavior of (a) Average fixed cost and (b) Average Variable Cost as more units of a good are produced?
Answer:
(a) Average Fixed Cost (AFC):
- AFC continuously falls with increase in output.
(b) Average Variable Cost (AVC):
- AVC first falls due to increasing returns.
- Afterwards, it rises due to diminishing returns.
- Therefore, AVC is U-shaped.
21. State the behavior of: (a) Total fixed cost and (b) Total Variable Cost as output is increased.
Answer:
(a) Total Fixed Cost (TFC):
- TFC remains constant at all levels of output.
(b) Total Variable Cost (TVC):
- TVC increases with increase in output.
- Initially, it rises at a decreasing rate and later at an increasing rate.
22. Justify the statement, ‘In economics, normal profits are always a par of total cost’.
Answer: Normal profit is the minimum reward required by an entrepreneur to continue production. It is treated as an implicit cost because it is the return on the entrepreneur’s own resources. Therefore, in economics, normal profit is included in total cost.
23. Explain the behavior of Average Fixed Cost. Use diagram.
Answer: Average Fixed Cost (AFC) is the fixed cost per unit of output. As output increases, AFC continuously decreases because the same fixed cost is spread over more units. Hence, the AFC curve is a downward-sloping rectangular hyperbola.
AFC = FC ÷ Output
Long Answer Type Questions
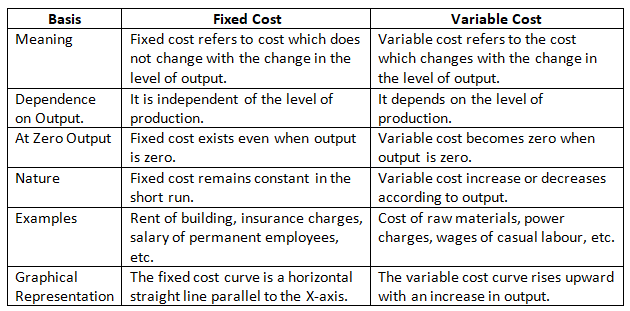
- Explain, in brief, the various points of difference between fixed cost and variable cost.
Answer: The cost of production is divided into two parts: Fixed Cost and Variable Cost. Both costs have different characteristics depending upon their behaviour with the level of output.
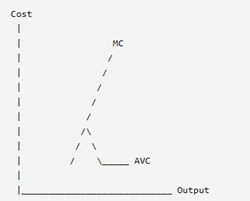
2. Explain the relationship between average variable cost and marginal cost with the help of a diagram.
Answer: Average Variable Cost (AVC) refers to the variable cost per unit of output, whereas Marginal Cost (MC) refers to the addition made to the total cost by producing one more unit of output.
The relationship between AVC and MC is explained as follows:
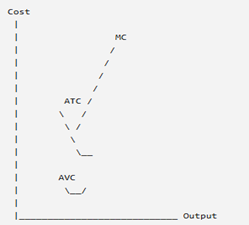
3. Draw Average Variable Cost (AVC), Average Total Cost (ATC) and Marginal Cost (MC) curves in a single diagram. State the relation between MC curve and AVC & ATC curves.
Answer: Average Variable Cost (AVC), Average Total Cost (ATC) and Marginal Cost (MC) curves show the behaviour of different costs at different levels of output.
Relationship between MC and AVC Curve
- When MC is less than AVC, AVC falls.
- When MC becomes equal to AVC, AVC is at its minimum point.
- When MC is greater than AVC, AVC rises.
Relationship between MC and ATC Curve
- When MC is less than ATC, ATC falls.
- When MC is equal to ATC, ATC is at its minimum point.
- When MC is greater than ATC, ATC rises.
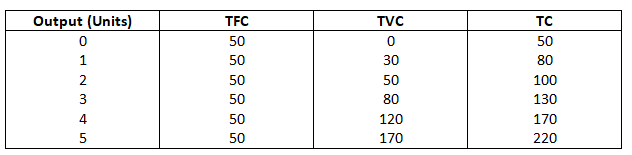
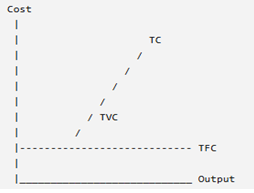
4. Explain the relationship between TC, TVC and TFC with the help of a hypothetical schedule and diagram.
Answer:
The total cost of production is divided into three parts:
Total Fixed Cost (TFC): Total Fixed Cost refers to the cost which remains constant at all levels of output in the short run.
Total Variable Cost (TVC): Total Variable Cost refers to the cost which changes with changes in the level of output.
Total Cost (TC): TC = TFC + TVC
Hypothetical Cost Schedule
Relationship between TC, TVC and TFC
- TC is the sum of TFC and TVC.
TC = TFC + TVC
2. At zero level of output:
- TVC is zero.
- TC is equal to TFC.
3. As output increases:
- TVC increases.
- TC also increases.
- The difference between TC and TVC remains constant and is equal to TFC.
5. Why does the difference between Average Total cost and Average Variable Cost decrease with an increase in the level of output? Can these two be equal at some level of output? Explain.
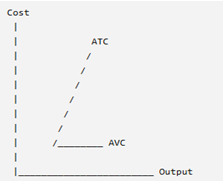
Answer: Average Total Cost (ATC) and Average Variable Cost (AVC) are two important concepts of cost. The difference between ATC and AVC is due to Average Fixed Cost (AFC).
The relationship among them is:
ATC = AVC + AFC
Reason for Decrease in Difference between ATC and AVC
- Average Fixed Cost (AFC) decreases continuously with an increase in output.
- Fixed cost remains constant in total, but when output increases, the same fixed cost is spread over a larger number of units.
- As a result, AFC per unit decreases, causing the difference between ATC and AVC to decrease.
Can ATC and AVC become equal?
Yes, theoretically ATC and AVC can become equal when AFC becomes zero.
However, in actual practice, AFC never becomes zero because fixed cost always remains positive. It only approaches zero but never touches the X-axis.
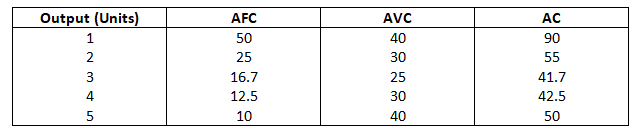
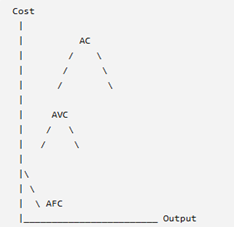
6. Define average fixed cost (AFC), average variable cost (AVC) and average cost (AC). Draw a diagram with the help of an imaginary schedule and discuss the shapes of AFC, AVC and AC curves.
Answer:
1. Average Fixed Cost (AFC) – Average Fixed Cost refers to the fixed cost per unit of output.
AFC = TFC / Output
2. Average Variable Cost (AVC) – Average Variable Cost refers to the variable cost per unit of output.
AVC = TVC / Output
3. Average Cost (AC) or Average Total Cost (ATC) – Average Cost refers to the total cost per unit of output.
AC = TC / Output
Imaginary Schedule
Shapes of Cost Curves
1. Shape of AFC Curve
- AFC curve is a rectangular hyperbola.
- It continuously falls as output increases.
- It approaches the X-axis but never touches it.
2. Shape of AVC Curve
- AVC curve is U-shaped.
- Initially, AVC falls due to increasing returns to variable factor.
- After reaching the minimum point, AVC rises due to diminishing returns.
3. Shape of AC Curve
- AC curve is also U-shaped.
- Initially, AC falls because both AFC and AVC fall.
- Later, AC rises because the increase in AVC is greater than the fall in AFC.
7. State the relationship between: (a) Marginal cost and average variable cost; (b) Total cost and marginal cost.
Answer:
(a) Relationship between Marginal Cost and Average Variable Cost – Marginal Cost (MC) refers to the addition made to the total cost by producing one more unit of output.
MC = ΔTC / Δ Output
The relationship between MC and AVC is as follows:
- When MC is less than AVC, AVC falls.
- When MC is equal to AVC, AVC is at its minimum point.
- When MC is greater than AVC, AVC rises.
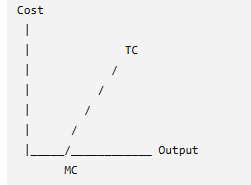
(b) Relationship between Total Cost and Marginal Cost
The relationship between TC and MC is explained below:
- When MC is falling: TC increases at a decreasing rate.
- When MC is minimum: TC increases at the slowest rate.
- When MC is rising: TC increases at an increasing rate.
- MC is the slope of TC curve, which means MC measures the rate of change in total cost.
Unsolved Practical’s
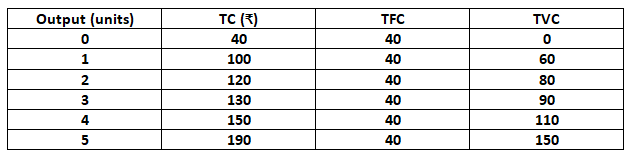
- Calculate Total Fixed Cost (TFC) and Total Variable Cost (TVC).

Solution –
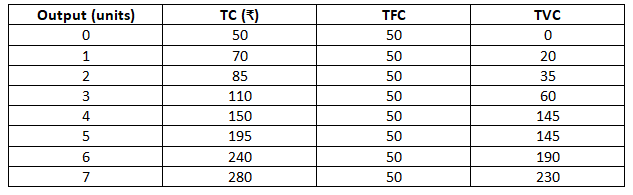
2. Find TFC and TVC.

Solution –
3. Determine TFC and TVC from the following particulars:

Solution –

4. Estimate total cost, given that TFC at 0 level of output is Rs.60.

Solution –
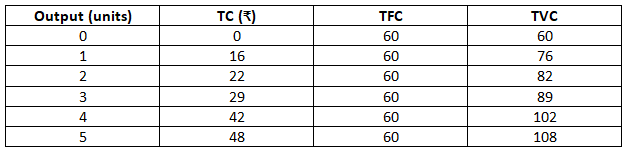
5. Complete the following table:

Solution –

6. Given that fixed costs is Rs.30, calculate: (a) marginal cost and (b) Total cost from the following:

Solution –

7. The table given below shows the total cost of a firm at different levels of output. Calculates marginal cost and average variable cost at each level of output.

Solution –
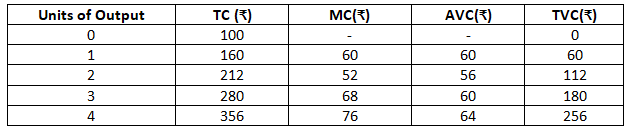
8. Calculate total variable cost and marginal cost at each given level of output from the following table:

Solution –
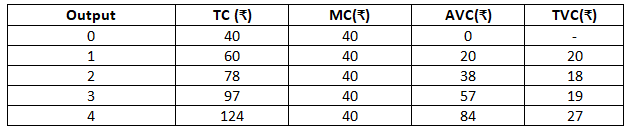
9. Calculate TFC, TVC, AFC, AVC and MC.

Solution –
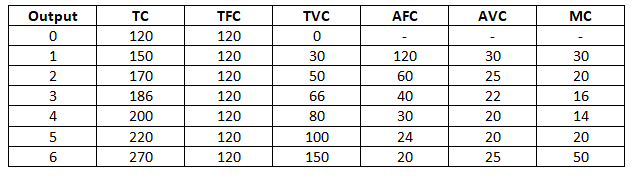
10. Calculate TVC and AVC from the following table:

Solution –

11. Compute TFC, TVC, AVC, AFC, AC and MC.

Solution –
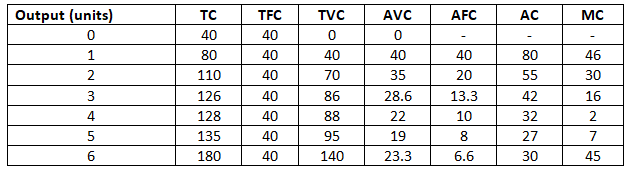
12. Given that fixed costs is Rs.20, calculate: (a) Total Variable Cost and (b) Total Cost from the following:

Solution –

13. Fixed costs of a firm are Rs.30. Its total variable cost at different levels of output is given below. Calculate total cost and marginal cost at each level of output.

Solution –

14. Find MC from the following data:

Solution –
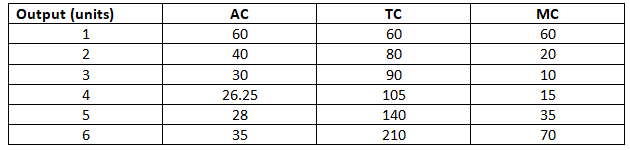
15. Calculate total and average variable cost of a firm at each given level of output from its cost schedule given below:
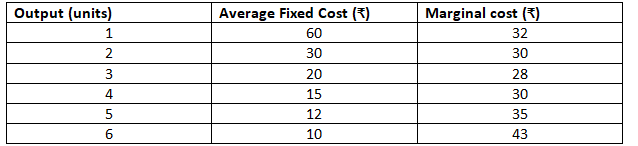
Solution –
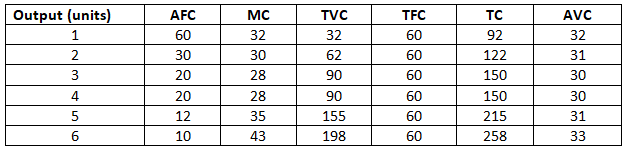
16. Calculate Marginal cost and Average Variable Cost from the following cost schedule of a firm whose Total Fixed Costs are Rs.10:

Solution –

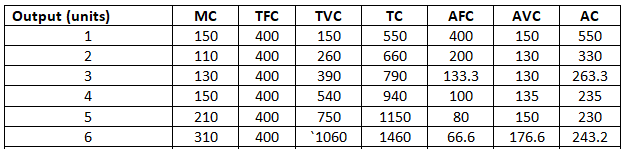
17. A firm’s fixed cost is Rs.400. compute TC, TVC, AFC, and AC from the following table:

Solution –
18. Calculate Total Variable Cost and Marginal Cost from the following cost schedule of a firm whose Total fixed Costs are Rs.12:

Solution –

19. Assuming that the total fixed cost is Rs.24, complete the following table:

Solution –

20. Determine AC and MC:

Solution –
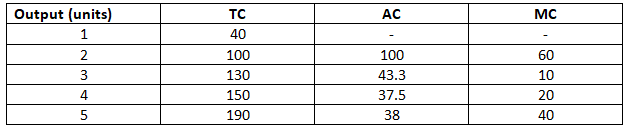
21. A firm’s average fixed cost, when it produces 2 units, is Rs.30. Its average total cost schedule is given below. Calculate its marginal cost and average variable cost at each level of output.

Solution –

22. Suppose that TFC is Rs.120, find out: (i) TC and (ii) MC from the following data:

Solution –
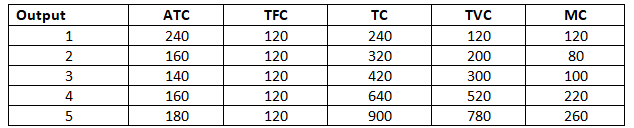
23. Find AC and TC from the following table:

Solution –

24. Find TC and MC, given TFC is ₹60.

Solution –

25. Find TC and AVC, given TFC is ₹120.

Solution –

26. Calculate AVC at each level of output.

Solution –

27. The information about the total cost for a firm is given below:

From this information find out: (a) Average fixed cost of producing 3 units; (b) Marginal cost of producing 4th unit; (c) Output level when marginal cost is the greatest; (d) Total variable cost of producing 5 units; (e) Average variable cost of producing 3 units; (f) Average total cost of producing 4 units.
Solution –
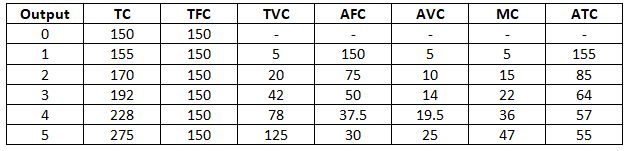
28. Calculate Marginal Cost and Total Cost from the following Cost Schedule of a firm whose Total Fixed Costs are Rs.15.

Solution –

29. Find out the missing figures from the table given below:

Solution –
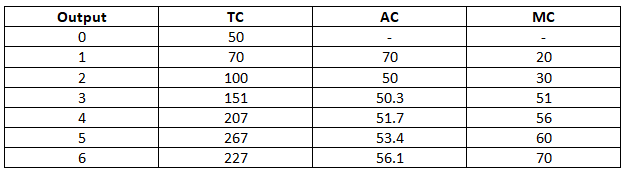
30. Find out the missing figure from the table given below:
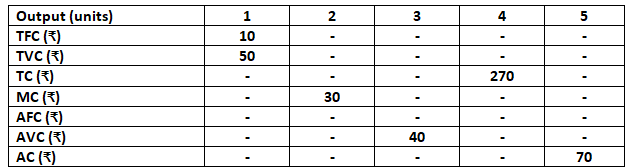
Solution –
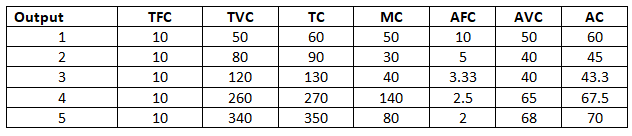
31. Complete the following table:
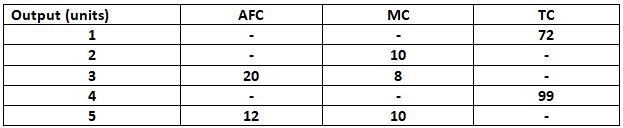
Solution –
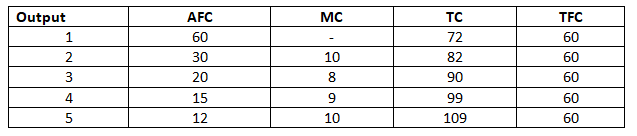
32. Find AVC and MC at each level of output.

Solution –

33. A firm is producing 20 units. At this level of output, ATC and AVC are respectively equal to Rs.40 and Rs.37. Find out the total fixed cost of the firm.
Solution –

34. Output increase from 3 units to 4 units. As a result, TC rises from Rs.19.60 to Rs.24.50. Find out MC.
Solution –
MC = ΔTC/ΔQ
= 24.50 – 19.60/4 – 3
= Rs.4.9
35. Calculation AC, AVC and the amount of profit that the firm will earn, if it sells the entire output at Rs.60 per unit.
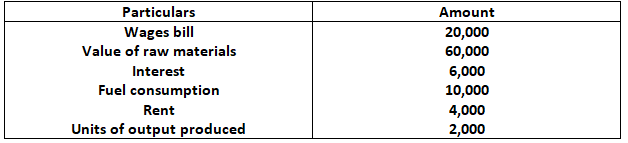
Solution –
Total cost = Wages bill + Value of raw materials + Interest + Fuel consumption + Rent
= 20,000 + 60,000 + 6,000 + 10,000 + 4,000
= Rs.1,00,000
AC = TC/Output
= 1,00,000/2,000
= Rs.50
TVC = Wages bill + Value of raw materials + Fuel consumption
= 20,000 + 60,000 + 10,000
= Rs.90,000
AVC = TVC/Output
= 90,000/2,000
= Rs.45
36. Complete the following table:
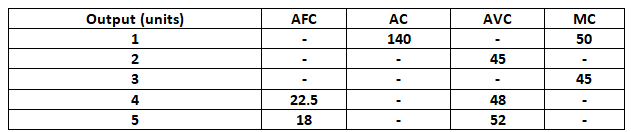
Solution –
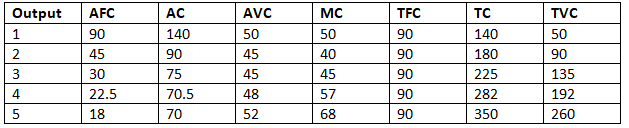
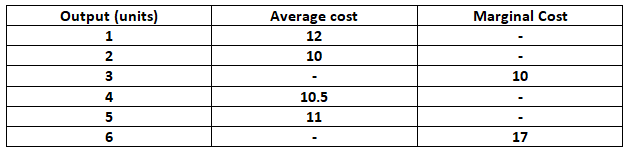
37. Complete the following table:
Solution –
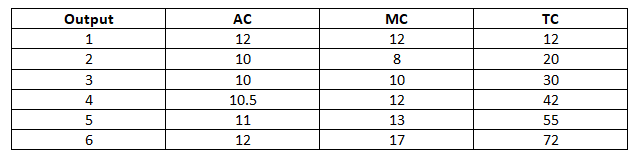
38. Calculate marginal cost at each level of output:

Solution –
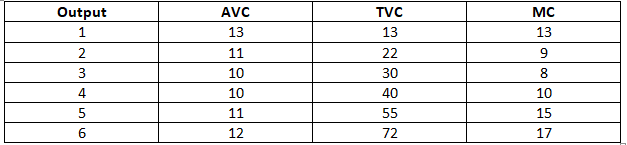
39. Calculate marginal cost at each level of output.

Solution –
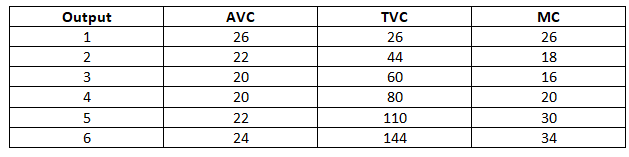
40. Calculate average variable cost at each level of output:

Solution –
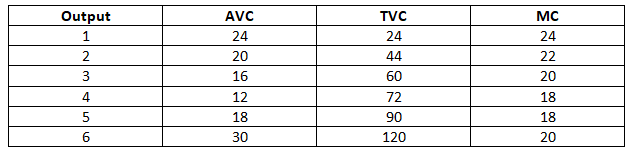
41. Complete the following table:
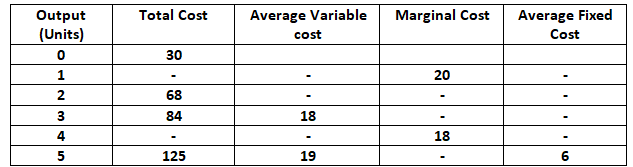
Solution –
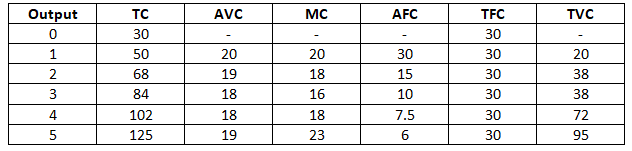
42. Complete the following table:
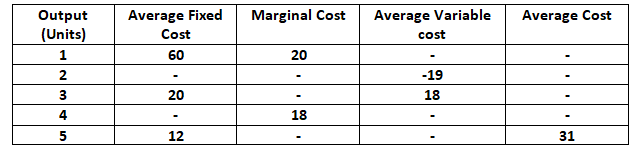
Solution –
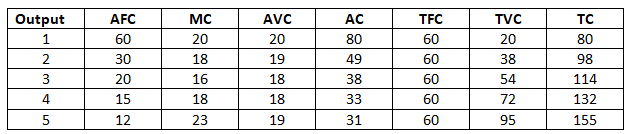
43. Complete the following cost schedule:

Solution –
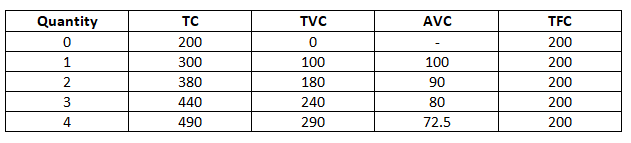
NCERT