Presentation of Data
Presentation of data refers to exhibiting or putting up data in an attractive and useful manner so that data can be easily analysed and interpreted.
Textual Presentation (Or Descriptive Presentation)
It is the most common method used to present data when the quantity of data is not very large.
- Meaning – When data is presented in the form of text, it is known as Textual Presentation.
- Suitability – It is more suitable when the quantity of data is not too large.
- Example – In 2024, out of a total of 2,000 application in a college, 1,200 were from Commerce background. The number of girls were 750, out of which 330 were from Science stream. In 2025, the total number of applicants were 3,500 of which 2,200 were boys. The number of students from Science stream were 1,000 of which 610 were girls.
- Limitation – Textual presentation does not convey information at a more glance; the reader must go through the entire text to understand the data. It is also not suitable for large datasets, as it becomes to compare, analyse, and draw meaningful conclusions. The given example will become more clear when presented in the form of tabulation (refer Example 9).
Tabular Presentation
Meaning of tabulation – Tabulation is a systematic presentation of numerical data in rows and columns. It is designed to simplify presentation and facilitate analysis. Such presentation facilitates comparison by bringing related information close to each other and helps in further statistical analysis and interpretation with self explanatory headings, sub-heading and notes.
Objective of Tabulation –
- To simplify the complex data – Tabulation aims to present the classified data in an orderly manner. The idea is to reduce the bulk of information (data) under investigation into a simplified and meaningful form.
- To economize space – Tabulation aims to save space by condensing data in a meaningful form, without sacrificing the quality and quantity of data.
- To facilitate comparison – It also aims to facilitate quick comparison among various observations by presenting the data in a tabular form.
- To facilitate statistical analysis – Tabulation aims to facilitate statistical analysis as it is a phase between classification and presentation of data.
Requisites Or Essentials of a Good Table
A good table must possess the following characteristics:
- Title – There must be a title on the top of the table. The title must be brief, clear and self explanatory.
- Manageable Size – The table should be neither too big nor too small. The size of table should be according to its objectives and characteristics of data. It should fully cover important characteristics of data.
- Attractive – A table should have an attractive get up which is appealing to the eye and the mind so that the reader may grasp it without any strain.
- Special Emphasis – The data which are to be compared should be placed at the left-hand corner of columns and their titles should be written in bold letters.
- Suit the purpose – The table should be according to the object of statistical investigation.
Parts of A Table
- Captions or Columns Headings – Caption is the title or heading given to the columns of a table. Sub-heads are used when a caption needs to be further broken down into smaller groups. For example – a caption of ‘Employees’ may have male and female employees ass sub-heads.
- Stubs or Row Headings – Stubs refer to the headings of horizontal rows. A brief description of the row headings may also be given at the left had top in the table.
- Body of Table – It is most essential part of a table because it contains all the numerical data and information. The data is arranged logically, from top to bottom in columns and from left to right in rows.
- Unit of Measurement – The unit of measurement of the figures in the table should be stated. For example – if a table shows income, it should be specified whether the figures are in rupees, thousands of rupees, or lakhs of rupees.
- Head Notes – If the main title does not give full information, a head note is added just below it (in brackets). It is inserted to convey all the relevant information about the data. Head notes are also known as Prefatory Note.
- Footnotes – Footnotes are given for the purpose of clarification. They help to explain data that is not clear from the main title, heading or captions.
- Source Note – It is an essential part of any table using secondary data. Source, Note shows the source from where the data is taken. It is written at the bottom of the table, after footnotes. A source note should include details like the name of the publication, page number, year of publication, etc.
Format of the Table
Let us understand the parts of table with the help of following specimen of a table:
Format of Table
Table Number…….
Title………….
(Head note, if any) Unit of Measurement
Types of Tables –
Classification on the basis of Objective or Purpose
- General Purpose Table – A General Purpose Table represents the raw data in great detail and covers variety of information on the same subject. It presents the data without any specific analytical purpose. It is also known as ‘Reference Table’ or ‘Repository Table’.
Classification on the basis of Nature of Data
- Original Table – The Original Table contains the statistical facts in their original form, i.e. figures in this type of table are not rounded up.
- It contains data, which was initially collected from the original (primary) source.
- It is also known as ‘Primary Table’ or ‘Classification Table’.
2. Derived Table – A table which presents results derived from the original data like averages, percentages, rations, etc., is known as Derived Tables.
- It expresses the information derived from original or primary tables.
- It is also known as a ‘Derivative Table’.
Classification on the basis of Extent of Coverage
On the basis of extent of coverage (or construction), tables may be of two types:
- Simple Tables – This is the simplest form of a tables, in which data is presented according to one characteristic only.
- Univariate frequency distribution is presented in one-way table as only one variable is under study.
- It is also known as ‘One-way Table’ or ‘First Order Table’.
- Specimen of Simple Table: The following Simple Table shows the number of students in different section of Class XIth.
2. Complex Table – A table which presents data according to two or more characteristics is known as complex table. On the basis of characteristics, complex table can be divided into three parts:
- Two-way Table (or Double Table) – It gives information about two interrelated characteristics of a particular phenomenon. For example – if number of students of Class XIth in different sections are further divided sex-wise, the table would become a two-way table.
- Three-way Table (or Treble Table) – In a three-way table, three characteristics of the data are classified. It gives information regarding three inter-related characteristics of a particular phenomenon.
- Manifold Table – The table which explains more than three characteristics of the data, is known as Manifold Table. These tables provide information on a large number of interrelated problems or characteristics of a given phenomenon. This is the most complex form of a table.
Merits of Tabulation
- Simplification of Data – Tabulation presents the data is a very concise and simple form. The tabulated data is easy to understand.
- Facilitates comparison – Tabulation makes comparison easy as figures are presented in classified way in distinct columns and rows.
- Analysis and Interpretation – Tabular Presentation facilitates analysis and interpretation of data with the help of statistical measures such as averages, dispersion, correlation, etc.
- Economical – Tabular Presentation is economical as tabulated data requires less space and time for its presentation.
- Provides Reference – Tabulation data and information serves as a source of reference as it is used in different researches and studies.
Let us understand the tabulation of data with some Practical Example.
Unsolved Practical’s
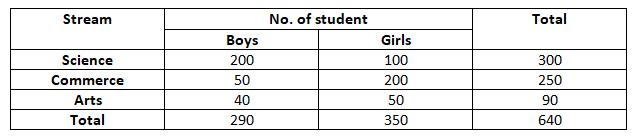
- Draw a blank table to show the number of students appearing in the CAT examination according to sex and stream (Science, Commerce and Arts.)
Solution –
Number of student appearing in CAT exam
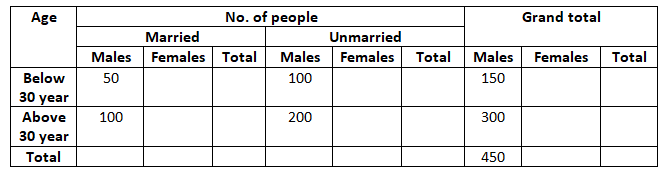
2. Prepare a blank table for tabulating populating of Delhi according to sex, marital status, and age (below 30 years and above 30 years).
Solution –
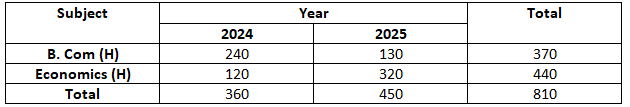
3. In 2024, out of a total of 360 students in a college, 240 were for B. Com (H) and the rest for Eco (H). In 2025, total number of students was 450. Out of them, 320 were for Eco (H). Tabulate the given information.
Solution –
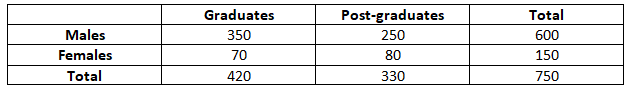
4. Out of total number of 750 people, who applied for job in Reliance Industries, 150 are females. Out of total applicants, 420 are graduates and others are post graduate. The number of male applicants who are post graduate are 250. Tabulate the given information.
Solution –
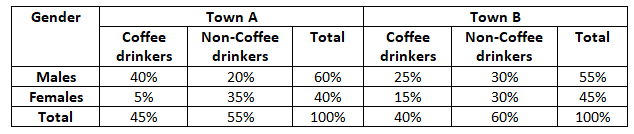
5. In a sample study about coffee habit in two towns, the following information was received:
- Town A: Females were 40%; Total coffee drinkers were 45% and Males non-coffee drinkers were 20%.
- Town B: Males were 55%; Males non-coffee drinkers were 30% and Females coffee drinkers were 15%. Present the data in a tabular from.
Solution –
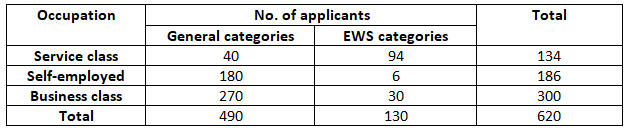
6. Out of total of 620 parents, who applied for admission of their child in a school, 130 belong to EWS (Economically Weaker Section) category. In the general category, 40 parents are of service class, 180 are self-employed and remaining are of business class. In the EWS category, 94 parents belong to service class. If total business class applicants are 300, then tabulate the given information.
Solution –
Number of Application for admission on the basis of occupation & financial criteria
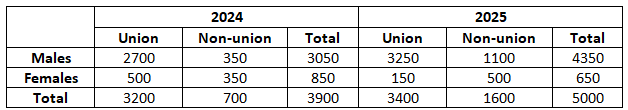
7. Presents the following information in a suitable tabular form, supplying the figures not directly given.
- union workers was 700, of which, 350 were women.
- In 2025, out of total 5,000 workers, 3,400 were members of union. The numbers of women workers employed was 650, out of which, 500 did not belong to any union.
Solution –
Number of workers part of trade union and non-trade union in 2024 & 2025 according to gender
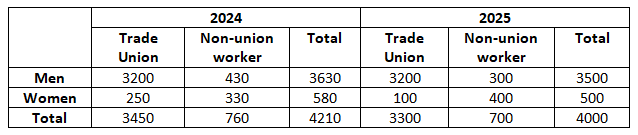
8. Present the following information in a suitable tabular from:
- In 2024, the number of workers in the Trade Union was 3,450 of which 3,200 were men. The number of non-union workers was 760 of which 330 were women.
- In 2025, out of a total 4,000 workers in a factory, 3,300 were members of a trade union. The number of women workers employed was 500 out of which 400 did not belong to any trade union.
Solution –
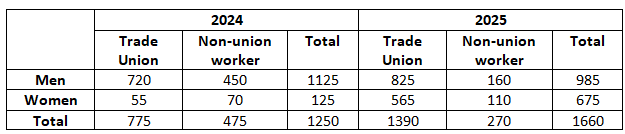
9. In 2024, out of total 1,250 workers in a factory, 775 were numbers of a trade union. The number of women workers employed was 125, out of which 70 did not belong to any trade union. In 2025, the number of union workers was 1,390 of which 825 were men. The number of non-union workers was 270, among which 110 were women. Present the given information in a suitable tabular from.
Solution –
Number of workers part of trade union & non-trade union in 2024 & 2025 according to gender
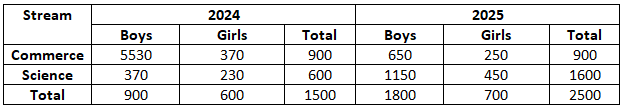
10. Tabulate the given information:
- In 2024, out of a total of 1,500 applicants in a college, 900 were from Commerce background. The number of girls was 600, out of which 230 were from Science stream.
- In 2025, the total number of applicants was 2,500 of which 1,800 were boys. The number of students from Science stream was 1,600 of which 450 were girls.
Solution –
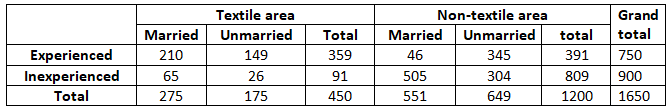
11. Out of a total number of 1,650 persons interviewed for appointment in a factory, 450 were from textile areas and the rest were from non textile areas. Among the married men who belonged to textile areas, 210 were experienced and 65 inexperienced, while for non-textile areas, the corresponding figures are 46 and 505 respectively. The total number of inexperienced persons was 900 of whom 91 resided in textile areas, Present the given data in a suitable table.
Solution –