comparative development experiences of india and its neighbours class 12
In this blog post, we will explore the comparative development experiences of india and its neighbours class 12 in detail.
These notes aim to enhance understanding of the comparative development experiences of india and its neighbours class 12.
Students can access the comparative development experiences of india and its neighbours class 12 pdf for further reading.
The economic aspects of the comparative development experiences of india and its neighbours class 12 are crucial for understanding regional dynamics.
comparative development experiences of india and its neighbours class 12 notes
Analyzing the comparative development experiences of india and its neighbours class 12 provides insights into their unique challenges and strategies.
comparative development experiences of india and its neighbours class 12 pdf
By studying the comparative development experiences of india and its neighbours class 12, we can identify key lessons for economic policy.
It is essential to understand the comparative development experiences of india and its neighbours class 12 to appreciate their historical contexts.
The comparative development experiences of india and its neighbours class 12 highlight the importance of regional cooperation.
In terms of education, the comparative development experiences of india and its neighbours class 12 reveal different approaches to learning.
This article will discuss the contemporary implications of the comparative development experiences of india and its neighbours class 12.
comparative development experiences of india and its neighbours class 12 economics
Finally, we will summarize the key findings of the comparative development experiences of india and its neighbours class 12.
Understanding the comparative development experiences of india and its neighbours class 12 will enable students to critically evaluate economic policies.
DEVELOPMENT PATH OF INDIA, PAKISTAN AND CHINA
India, Pakistan and China have many similarities in terms of their development strategies.
- All the three nations started their development path at the same time.
- India and Pakistan got independence in 1947 and People’s Republic of China was established in 1949.
- All the three countries had started planning their development strategies in similar ways. India announced its first Five Year Plan in 1951, Pakistan announced it in 1956 and China in 1953. Five-year plan is a medium-term development plan which focuses on multiple challenges on economic, security and development fronts.
- Since 2013, Pakistan has been working on the basis of the 11th Five Year Development Plan (2013-18), while China is working on the 13th Five Year Plan (2016-20). Until March 2017, India has been following the Five Year Plan-based development model.
CHINA
- Historical Background
China has one of the world’s oldest people and continuous civilizations, consisting of states and cultures dating back more than six millennia. The People’s Republic of China (PRC), commonly known as China, was established in 1949.
- Geography
China is situated in eastern Asia, bounded by the Pacific in the east. It is the third largest country in the world, next to Canada and Russia, with an area of 9.6 million square kilometers.
- Population and Language
The historical context of the comparative development experiences of india and its neighbours class 12 sets the foundation for current discussions.
China is the most populous country in the world 1,393 million people (as per world Development Indicators 2019) and a growth rate of 0.5% per annum.
These comparative development experiences of india and its neighbours class 12 serve as a valuable resource for students and scholars alike.
In conclusion, the comparative development experiences of india and its neighbours class 12 offer a rich field for academic inquiry.
- Economy
Being one of the oldest civilizations in the world, China has been the world’s largest economy.
- Great Leap Forward (GLF) Campaign – in 1958, a programme named ‘The Great Leap Forward (GLF)’ campaign was initiated by Mao Zedong to modernize China’s economy.
- The aim of this campaign was to transform agrarian economy into a modern economy through the process of rapid industrialization.
- Under this programme, people were encouraged to set up industries in their backyards.
2. Great Proletarian Cultural Revolution – In 1965, Mao Zedong introduced the Great Proletarian Cultural Revolution (1966-76), under which students and professional were sent to work and learn from the countryside.
3. Reforms Introduced in China – The present-day fast industrial growth in China can be traced back to the reforms introduced in 1978. China introduced reforms in phases.
- In the initial phase, reforms were initiated in agriculture, foreign trade and investment sectors.
- In the later phase, reforms were initiated in the industrial sector.
4. Dual Pricing in the Reforms Process – The reform process also involved dual pricing. This means fixing the prices in two ways:
- Farmers and industrial units were required to buy and sell fixed quantities of inputs and outputs on the basis of prices fixed by the government.
- For other transactions, the inputs and outputs were purchased and sold at market prices.
5. Special Economic Zones (SEZs) – In order to attract foreign investors, special economic zones were set up.
PAKISTAN
- Historical Background
Pakistan, officially the Islamic Republic of Pakistan, gained independence on 14th August, 1947. In 1971, a civil was in East Pakistan resulted in the independence of Bangladesh.
- Geography
Pakistan is located in South Asia and borders Central Asia and the Middle East. Its borders are with China in the North and towards West and North west are Iran and Afghanistan and towards East and South East, its borders are with India.
- Population and Language
Pakistan is the sixth most populous country in the world with 212 million people (as per World Development Indicators 2019) with a growth rate of 2.1% per annum.
- Economy
A. Mixed Economic System – Pakistan follows the mixed economy model with co-existence of public and private sectors.
B. Introduction of Various Policies – In the late 1950s and 1960s, Pakistan introduced a variety of regulated policy frameworks for the growth of domestic industries. The policy combined tariff protection for manufacturing of consumer goods, together with direct import controls on competing imports, i.e. Pakistan also introduced an Import Substitution Policy (like India) in order to protect the domestic industries from foreign competition.
C. Green Revolution – In case of agriculture, the introduction of Green Revolution and increase in public investment in infrastructure led to a rise in the production of food grains. This changed the agrarian structure dramatically.
D. Importance to Role of Public Sector in early 1970 – In the early 1970s, nationalization of capital goods industries took place.
COMPARATIVE STUDY – INDIA, CHINA AND PAKISTAN
Comparative study of the three countries, in terms of population, growth, sectoral development and other development indicators.
- Demographic Indicators
Let us compare some demographic indicators of India, China and Pakistan with the help of
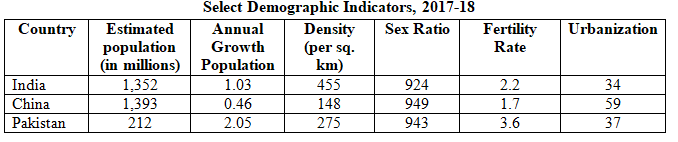
- Population – As compared to China or India, the population of Pakistan in much less (212 million people). If we look at the global population, out of every six persons living in this world, one is an Indian and another Chinese. The population of Pakistan is very small and accounts for roughly about one-tenth of China or India.
- Growth Rate of Population – Though, China is the most populated country, but its annual growth rate of population is the lowest (0.46%) as compared to India (1.03%) and Pakistan (2.05%). The reason for the low growth of population is the ‘One-Chile Policy’ introduced in China in the late 1970s.
- Density of Population – China is the third largest country in the world and growth rate of population is lowest in China as compared to India and Pakistan. As a result, density of population of China is the lowest as compared to India and Pakistan
- Sex Ratio – Due to preference of son, sex ratio is low and biased against females in all the three countries. Sex ratio is the lowest in India with 924 females per 1,000 males. In China and Pakistan, the corresponding figures are 949 and 943.
- Urbanization – Urbanization is the highest in China (59%). In India and Pakistan, the corresponding figures are 34% and 37%.
2. growth Indicators
Let us have a comparative study of the three countries in terms of GDP growth and sector growth.
- Growth Rate of Gross Domestic product (GDP) – GDP growth rate is considered as the single most important indicator of an economy during the period. China with second largest GDP in the world, as measured by purchasing power parity (PPP).
Annual Growth of Gross Domestic Product in Percent (1980-2017)

- During 1980-90
China was having double-digit growth of 10.3%;
Pakistan’s growth rate was 6.3%;
India was at the bottom with just 5.7% growth rate.
- During 2015-17
There was drastic fall in china’s growth rate from 10/3% to 6.8%.
Pakistan also met with a decline in annual growth of GDP from 6.3% to 5.3%.
India recorded and increase from 5.7% to 7.3% owing to efficient economic planning and better implementation as compared to Pakistan.
NOTE
Explore More : PPP (Purchasing Power Parity)
PPP shows the equality of purchasing power among countries, i.e., quantity of goods and services that can be bought with a unit of money.
- At the international level, the unit of money of India, Pakistan and China are India Rupee, Pakistan Rupee and Yuan respectively.
- The value of each domestic currency is different in different countries. For example, one India Rupee cannot buy the same quantity of goods and services in Pakistan or China as it can buy in India. Similar is the case with Pakistan Rupee and China’s Yuan.
- US Dollar is the universally accepted currency. Therefore, the GDPs of different countries are expressed in US Dollars ($)and called ‘PPP US $’.
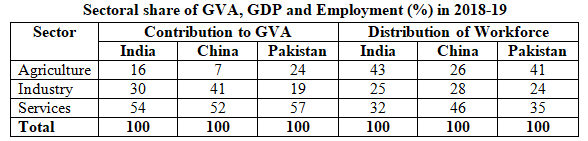
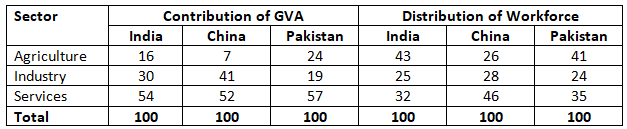
B. Sectoral Contribution – In all the three economics, the industry and services sector have less proportion of workforce, but they contribute more in terms of output. Let us have a brief review of the proportion of the workforce engaged in each sector and its contribution to the Gross Value Added (GVA).
Agriculture (Primary Sector)
In China
- Due to topographic and climatic conditions, the area suitable for cultivation is just 10% of its total land area.
- The total cultivable area in china accounts for 40% of the cultivable area in India.
- In India
The contribution of agriculture to GVA was 16%. The proportion of workforce engaged in agriculture was 43%.
- In Pakistan
The contribution of agriculture to GVA was at 25% , but proportion of workforce engaged in agriculture was 41% as compared to 43% of India.
- Industry (Secondary Sector)O
- Contribution to GVA
In China, secondary sector contributed 41% to China’s GVA, whereas in India and Pakistan, the share of secondary sector was 30% and 19% respectively.
- Service (Tertiary Sector) –
- Contribution to GVA
- In all three countries, the service sector contribution highest share of GVA. In both India and Pakistan, the service sector is emerging as a major player of development. Service sector contributes the highest to their GVA, with a contribution of 54% in case of India and 57% for Pakistan.
- The contribution of service sector to the GVA in China was 52%.
- 32. Human Development Indicators
Let us now discuss the performance of India, China and Pakistan in some of the selected indicators of human development
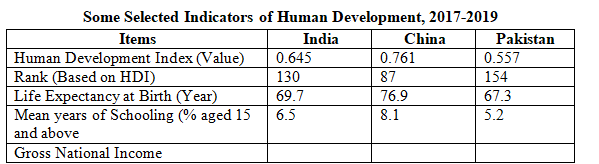
- Human Development Index (HDI) – HDI is an important indicator of socio-economic development. A higher value of HDI shows a higher level of growth and development in a country. In 2019, HDI for India, China and Pakistan was estimated to be 0.645, 0.761 and 0.557 respectively.
- Life Expectancy at Birth – Life expectancy refers to the average number of years for which people are expected to live. A country which provides better health and civic facilities secures a higher life expectancy for its citizens. A higher life expectancy indicates a longer and more active average life span.
- Mean years of schooling – It is highest in case of China with 8.1% , while the corresponding figures for India and Pakistan are 6.5% and 5.2% respectively.
- Gross National Income Per Capita (PPP US$) – Higher ranking of China in HDI is mainly due to higher Gross National Income per capita. Higher level of income of people in the country is the direct of greater economic activities in the country.
- People below Poverty Line – People below the poverty line are the people who do not even have that level of income and expenditure, which is necessary to meet specified minimum levels of calorie intake.
APPRAISAL OF DEVELOPMENT STRATEGIES
- Conclusions – china and Pakistan have travelled more than seven decades of development paths with varied results. Till the late 1970s, all of them were maintaining the same level of low development. The last three decades have taken these countries to different levels.
- India –
- Indian economy performed moderately, but the majority of its people still depend on agriculture.
- India has taken many initiatives to develop its infrastructure & improve it standard of living.
- It is yet to raise the standard fo living of more than one-fourth of its population that lives below the poverty line.
2. Pakistan
- Political instability, over-dependence on remittances and foreign aid along with volatile performance of agriculture sector are the reasons for the slowdown of the Pakistan economy.
- In the recent past, it is hoping to improve the situation by maintaining high rates of GDP growth.
- Many macroeconomic indicators began showing positive and higher growth rates, reflecting the economic recovery.
3. China
- In china, the lack of political freedom and its implications for human rights are major concerns.
- However, in the last four decades, it has used the market system without losing political commitment’ and succeeded in raising the level of growth along with alleviating poverty.
- China has used the market mechanism to create additional social and economic opportunities.
- By retaining collective ownership of land and allowing individuals to cultivate land, China has ensured social security in rural areas.
- Public intervention in providing social infrastructure brought positive results in human development indicators in China.
Short Answer Type Questions
- Why china’s population growth rate has sharply declined as compared to India and Pakistan?
Answer: China’s population growth rate declined rapidly because it adopted the One-Child Policy in 1979. The government also strictly implemented family planning programmes and increased awareness about small families. India and Pakistan did not adopt such strict policies, so their population growth declined more slowly.
2. Briefly discuss the similarities in the development strategies followed by India, Pakistan and China.
Answer: The three countries followed similar development strategies:
- They adopted central economic planning.
- They gave an important role to the public sector.
- They focused on industrialisation for economic growth.
- They followed import substitution to reduce dependence on foreign goods.
3. How is China’s experience different from that of India and Pakistan, in its industrial development?
Answer: China achieved faster industrial development because it introduced economic reforms in 1978, encouraged foreign investment, established Special Economic Zones (SEZs) and adopted an export-oriented policy. India and Pakistan experienced comparatively slower industrial growth.
4. Explain the concept of ‘Dual Princing’ adopted by China.
Answer: Dual Pricing means selling the same product at two different prices. Producers sold a fixed quantity to the government at a controlled price, while the remaining output could be sold in the open market at market prices. This encouraged higher production and economic reforms.
5. Briefly discuss and give a brief account of the contribution of agricultural sector in GDP of India, Pakistan and China.
Answer:
- India: Agriculture contributes about 15–17% to GDP.
- Pakistan: Agriculture contributes about 22–24% to GDP and has a major role in the economy.
- China: Agriculture contributes about 7–8% to GDP due to rapid industrialisation.
6. Compare the GDP growth of China, India and Pakistan.
Answer:
- China has recorded the highest GDP growth among the three countries due to economic reforms, rapid industrialisation and export-led growth.
- India has achieved a moderate GDP growth, especially after the 1991 economic reforms.
- Pakistan’s GDP growth has been comparatively lower and unstable because of political instability and economic problems.
7. Discuss “The Great Proletarian Cultural Revolution” introduced in China.
Answer: The Great Proletarian Cultural Revolution was launched by Mao Zedong in 1966.
- Its main objective was to strengthen socialist ideology and remove capitalist influences from society.
- Schools and universities remained closed for several years.
- Intellectuals and educated people were criticised and persecuted.
- The movement created political and social unrest and adversely affected education and production.
8. On the basis of the following information, compare and analyse the population growth rate among the given countries:

Source: World Development Indicators, 2017.
Answer: Analysis: The table shows that China has a much larger population than Pakistan, but its annual population growth rate is lower (0.5%). On the other hand, Pakistan has a smaller population, but its population growth rate is higher (2.1%). This indicates that Pakistan’s population is increasing at a faster rate compared to China.
9. Discuss two similar developmental strategies followed by India and Pakistan after 1947.
Answer: After independence in 1947, India and Pakistan followed some similar developmental strategies. The two major similarities were:
- Adoption of Planned Development: Both India and Pakistan adopted the strategy of economic planning to achieve rapid economic growth. India introduced Five Year Plans in 1951, while Pakistan also started development plans to improve its economy.
- Focus on Public Sector and Industrial Development: Both countries gave importance to the development of the public sector and industrialisation. The governments invested in industries, infrastructure and basic facilities to promote economic development.
10. On the basis of the given data:
Some Selected Indicators of Human Development, 2017 – 2019
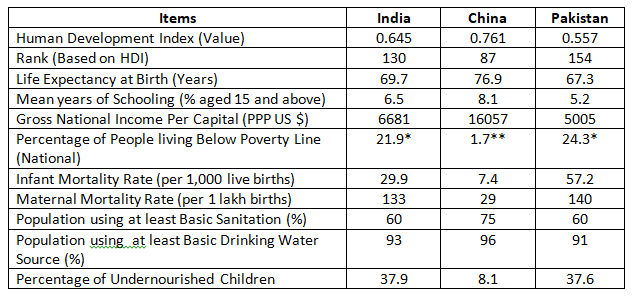
Note: *for the year 2011; ** for the year 2015.
Sources: Human Development Report 2019 and 2020.
- Identify one income indicator and one health indicator, each.
- Compare India and China on the basis of any one of the indicator identified above in part (i).
Answer:
(i) Income Indicator:
Gross National Income Per Capita (PPP US $) is an income indicator.
Health Indicator:
Life Expectancy at Birth (Years) is a health indicator.
(ii) Comparison between India and China (on the basis of GNI Per Capita):

Analysis: China has a higher Gross National Income per capita (16057 US $) compared to India (6681 US $). This shows that China has a better income level than India.
11. Explain briefly the problems faced by Great Leap Forward Campaign.
Answer: The Great Leap Forward Campaign was launched in China in 1958. It faced the following problems:
- It resulted in a severe fall in agricultural production.
- A great famine occurred during 1958-61, causing the death of millions of people.
- The campaign failed due to unrealistic targets and poor management.
12. Defince ‘Liberty Indicator’ with the help of an example and state its importance.
Answer: Liberty Indicator refers to the measure of the extent of freedom enjoyed by individuals in a country.
Example: Freedom of speech and expression, freedom to participate in political activities, etc.
Importance: It helps to measure the quality of life and level of development of a country.
13. “In the late 1970s, China introduced the One-child policy that lead to arrest in the population coupled with skewed sex ratio.” Justify the given statement with valid arguments in support of your answer.
Answer: China introduced the One-child policy in 1979 to control rapid population growth. It resulted in:
- A decline in the population growth rate of China.
- A shortage of females due to preference for male children, leading to a skewed sex ratio.
- A reduction in the size of the working population in the future.
14. On the basis of the data given below, discuss the shift in output and employment sector-wise, in India and China:
Sectoral share of Employment and GVA (%) in 2018 – 2019
Source: Human Development Report 2019; Key Indicators of Asia and Pacific, 2019
Answer:
Analysis:
- In India, the services sector contributes the highest share in GVA, while agriculture still employs a large workforce.
- In China, the industrial sector has a major contribution in GVA and employment.
- Both countries have moved from agriculture towards industry and services.
- The shift in China is more towards industry, whereas India has a greater shift towards services.
Conclusion:
China follows an industry-led growth pattern, while India follows a service-led growth pattern.
15. Read the following schedule carefully:
Trends in Output Growth in Different Sectors, 1980 – 2015

Analyse the output growth trend in the three sectors over the given years between India and China.
Answer: Analysis:
- Agriculture sector growth declined in both India and China during the given period.
- China recorded higher growth in the industrial sector as compared to India.
- India’s service sector showed better performance and increased from 6.9% to 8.4%.
- China’s growth was mainly based on industrial development, whereas India’s growth was mainly supported by the service sector.
Conclusion:
China followed an industry-oriented development strategy, while India followed a service sector-oriented development strategy.
16. Compare and analyse the following information related to Annual Growth of Gross Domestic Product (GDP) of India and China.
Annual Growth of Gross Domestic Product

Source: Asian Development Bank, Philippines, World Development indicator – 2018.
Answer: Analysis:
- During 1980–90, China had a higher GDP growth rate than India.
- In 2015–17, India’s growth rate increased and became higher than China.
- China’s growth slowed down due to the maturity of its economy.
- India’s growth improved due to economic reforms and expansion of the service sector.
Conclusion:
China achieved faster growth in the early period, while India showed better growth performance in the later period.
17. Appraise the development journey of India since 1947.
Answer: India’s development journey since 1947 can be explained as follows:
- India adopted a mixed economy with emphasis on both public and private sectors.
- It achieved progress in agriculture, industry, education and infrastructure.
- Economic reforms of 1991 increased growth and global integration.
- However, problems like poverty, unemployment and inequality still exist.
18. Explain valid reasons for the slow growth and re-emergence of poverty in Pakistan.
Answer: The reasons for slow growth and re-emergence of poverty in Pakistan are:
- Political instability and frequent changes in government.
- Dependence on foreign aid and loans.
- Low investment in education and health sectors.
- High population growth rate.
19. ‘To measure the extent of development in an economy, liberty indicators should be considered along with other socio-economic parameter’. Do you agree with the given statement? Give valid reasons in support of your answer.
Answer: Yes, liberty indicators should be considered because:
- They show the freedom and rights enjoyed by people.
- Economic growth alone cannot measure true development.
- Indicators like freedom of speech and political participation reflect the quality of life.
20. “United Nations Department of Economic and social Affairs indicated that India has overtaken China as the world’s most populous country in the month of April 2023.” Explain the consequences of one-child policy adopted by china in the 1970s.
Answer: The consequences of China’s one-child policy were:
- It reduced the population growth rate.
- It created an imbalance in the sex ratio due to preference for male children.
- It resulted in an ageing population and shortage of labour force.
21. Discuss the impacts of Special Economic Zones (SEZs) on the economic growth of China.
Answer: The impacts of SEZs on China’s economic growth were:
- They attracted foreign investment and advanced technology.
- They increased exports and employment opportunities.
- They helped in rapid industrialisation and economic growth.
22. “Scholars find son preference as a common phenomenon in India, Pakistan and China.” Justify the given statement in the light of skewed sex-ration.
Answer: Son preference in India, Pakistan and China has resulted in:
- Decline in the number of females compared to males.
- A low sex ratio due to female foeticide and neglect of girls.
- Social and economic factors encouraging preference for sons.
Long Answer type Questions
- Compare the demographic indicators of India with china and Pakistan.
Answer: Demographic indicators show the population characteristics and development level of a country. India, China and Pakistan differ in terms of their demographic indicators.
1. Population Size: China has the largest population among the three countries, followed by India. Pakistan has a comparatively smaller population.
2. Population Growth Rate: China has the lowest population growth rate due to its strict population control policy. India has a higher growth rate, while Pakistan has the highest population growth rate among the three countries.
3. Literacy Rate: China has a higher literacy rate as compared to India and Pakistan due to better educational facilities. India has improved its literacy rate, whereas Pakistan still has a lower literacy rate.
4. Life Expectancy: China has the highest life expectancy because of better healthcare facilities. India has shown improvement, while Pakistan has a lower life expectancy.
2. “The economies of China, India and Pakistan differ in terms of sectoral growth.” Comment.
Answer: The economies of India, China and Pakistan differ in terms of contribution and growth of various sectors.
India: In India, the service sector has become the major contributor to GDP. The growth of information technology, banking, transport and communication has increased the importance of this sector.
China: In China, the industrial sector has played the most important role in economic growth. Manufacturing industries and exports have helped China to achieve rapid growth.
Pakistan: In Pakistan, the agriculture sector continues to play an important role. A large part of the population depends on agriculture for employment.
3. Compare India and China on the basis of : (i) People below Poverty line: (ii) Growth Rate of Population; and (iii) Growth rate of Gross Domestic product.
Answer: India and China can be compared on the following basis:
(i) People below Poverty Line: China has been more successful in reducing poverty due to rapid economic growth and effective policies. India has also reduced poverty, but a large population remains below the poverty line.
(ii) Growth Rate of Population: China has a lower population growth rate due to the one-child policy. India has a higher population growth rate compared to China.
(iii) Growth Rate of GDP: China has achieved a higher GDP growth rate due to industrialisation, foreign investment and export promotion. India has also achieved high growth after economic reforms, mainly due to the service sector.
4. Briefly discuss the sectoral contribution to the GDP of India, Pakistan and China.
Answer: The contribution of different sectors to GDP is different in India, Pakistan and China.
India: The service sector contributes the highest share to India’s GDP. The contribution of agriculture has declined, while the service sector has grown rapidly.
China: The industrial sector contributes significantly to China’s GDP. Manufacturing industries and exports are the main reasons behind China’s economic growth.
Pakistan: Agriculture plays an important role in Pakistan’s economy. A large population depends on agriculture for employment and income.
5. Among the three sectors of the economy, which sector became the driving the driving force for achieving a higher growth rate in India and China?
Answer: Different sectors became the driving force of economic growth in India and China.
In India, the tertiary sector (service sector) became the main force behind growth. Information technology, banking, communication and other services contributed significantly to GDP growth.
In China, the secondary sector (industrial sector) became the main force of growth. Manufacturing industries, exports and foreign investment helped China achieve rapid economic development.
NCERT
https://ncert.nic.in/textbook.php
indian economy on the eve of independence class 12