Meaning of Accounting Ratios – Accounting ratios are an important tool of financial statement analysis. A ratio is a mathematical number calculated as a reference to relationship of two or more numbers and can be expressed as a fraction, proportion, percentage, and by referring to two accounting numbers derived from the financial statement, it is termed as accounting ratio.
Objectives of Ratio Analysis – Ratio analysis is indispensable part of interpretation of result revealed by the financial statements.
- To know the areas of the business which need more attention;
- To know about the potential areas which can be improved with the effort in the desired direction;
- To provide a deeper analysis of the profitability, liquidity, solvency and efficiency levels in the business;
Advantages of Ratio Analysis – The ratio analysis if properly done improves the user’s understanding of the efficiency with which the business is being conducted. The numerical relationships throw light on many latent aspects of the business. If properly analysed, the ratios make us understand various problem areas as well as the bright spots of the business.
There are many advantages derived from the ratio analysis. These are summarized as follows:
- Helps understand efficacy of decisions
- Simplify complex figures and establish relationships
- Helpful in comparative analysis
- Identification of problem areas
- Enables SWOT analysis
- Various comparisons
Limitations of Ratio Analysis – The limitations of ratio analysis which arise primarily from the nature of financial statement are as under:
- Limitations of Accounting Data
- Ignores Price-level Changes
- Ignore Qualitative or Non-monetary Aspects
- Variations in Accounting Practices
- Forecasting
Types of Ratios – There is a two way classification of ratios:
(i) Traditional classification
- Income Statement Ratio: A ratio of two variables from the income statement is known as income statement ratio. For example, ratio of gross profit to sales known as gross profit ratio is calculated using both figures from the Income statement.
- Balance Sheet Ratios – In case variables are from balance sheet, it is classified as Balance Sheet Ratios. For example, ratio of current assets to current liabilities known as current ratio is calculated using both figures from balance sheet.
- Composite Ratios – If a ratio is computed with one variable from income statement and another variable from balance sheet, it is called Composite Ratio.
(ii) functional classification
- Liquidity Ratios – To meet its commitments, business needs liquid funds. The ability of the business to pay the amount due to stakeholders as and when it is due is known as liquidity, and the ratios calculated to measure it are known as ‘Liquidity Ratios’. They are essentially short-term in nature.
- Solvency Ratios – Solvency of business is determined by its ability to meet its contractual obligations towards stakeholders, particularly towards external stakeholders, and the ratios calculated to measure solvency position are known as ‘Solvency Ratios’. They are essentially long-term in nature, and
- Activity (or Turnover) Ratio – this refers to the ratios that are calculated for measuring the efficiency of operation of business based on effective utilization of resources. Hence, these are also known as ‘efficiency ratios’.
- Profitability Ratio – It refers to the analysis of profits in relation to sales or funds (or assets) employed in the business and the ratios calculation to meet this objective are known as ‘Profitability Ratios’.
Liquidity Ratio –
- Current Ratio – Current ratio is the proportion of current assets to current liabilities. It is expressed as follows:
Current Ratio = Current Assets : Current Liabilities or Current Assets/Current Liabilities
2. Quick Ratio – It is the ratio of quick (or liquid) asset to current liabilities. It is expressed as
Quick ratio = Quick Assets : Current Liabilities or Quick Assets/Current Liabilities
Solvency Ratios –
- Debt equity ratio;
- Debt ratio;
- Proprietary ratio;
- Total Assets to Debt Ratio;
- Interest Coverage Ratio.
Debt-Equity Ratio –
Debt-Equity ratio = long-term Debts’ shareholder fund or long term debt/share holders fund
Debt Ratio –
Debt Ratio = Total Debt / Total Assets
Proprietary Ratio –
Proprietary Ratio = Shareholders Funds/Capital employed (or net assets)
Total Assets to Debt Ratio – This ratio measures the extent of the coverage of long-term debt by assets. It is calculated as
Total assets to Debt Ratio = Total Assets/Long term Debt
Interest Coverage Ratio – It is a ratio which deals with the servicing of interest on loan. It is a measure of security of interest payable on long-term debt. It expresses the relationship between profits available for payment of interest and the amount of interest payable. It is calculated as follows:
Interest Coverage Ratio = Net Profit before Interest and Tax/Interest on long term debt
Activity (or Turnover) Ratios-
- Stock turn-over
- Debtors (Receivable) Turnover;
- Creditors (Payable) Turnover;
- Investment (Net Assets) Turnover
- Fixed Assets Turnover;
- Working Capital Turnover.
Stock (or Inventory) Turnover Ratio –
Stock Turnover Ratio = Cost of Goods Sold/ Average Stock
Debtors (Receivables) Turnover Ratio –
Debtors Turnover ratio = Net Credit sales/Average Account Receivable
Where Average Account Receivable = (Opening Debtors and Bills Receivable + Closing Debtors and Bills Receivable)/2
Creditors (Payable) Turnover Ratio – Creditors turnover ratio indicates the pattern of payment of accounts payable. As accounts payable arise on account of credit purchases, it expresses relationship between credit purchases and accounts payable. It is calculated as follows:
Creditors Turnover ratio = Net Credit purchases/Average accounts payable
Where Average account payable = (Opening Creditors and Bills Payable + Closing Creditors and Bills Payable)/2
Investment (Net Assets) Turnover Ratio – It reflects relationship between employed in the business. Higher turnover means better liquidity and profitability. It is calculated as follows:
Investment (Net Assets) Turnover ratio = Net Sales/capital employed
Gross Profit Ratio – Gross profit ratio as a percentage of sales is computed to have an idea about gross margin. It is computed as follows:
Gross Profit Ratio = Gross Profit/Net Sales x 100
Operating Ratio – It is computed to analyse cost of operation in relation to sales. It is calculated as follows:
Operating Ratio = (Cost of Sales + Operating Expenses)/Net Sales x 100
Operating Profit Ratio – It is calculated to reveal operating margin. It may be computed directly or as a residual of operating ratio.
Operating Profit Ratio = 100 – Operating Ratio
Alternatively, it is calculated as under:
Operating Profit ratio = Operating Profit / Sales x 100
Where Operating Profit = Sales – Cost of Operation
Net Profit Ratio – Net Profit Ratio is based on all inclusive concept of profit. It relates sales to net profit after operational as well as non-operational expenses and incomes. It is calculated as under:
Net Profit Ratio = Net Profit /Sales x 100
Return on Capital Employed or Investment (ROCE or ROI)
Return on Investment (or Capital Employed) = Profit before Interest and Tax/Capital Employed x 100
Return on Shareholders’ Fund –
Return on Shareholders’ Fund = Profit after tax/Shareholders fund
Earnings Per Share –
EPS = Profit available for equity shareholders/No. of Equity Shares
Book Value Per Share –
Book Value Per Share = Equity shareholders’ funds/No. of Equity Shares
Dividend Payout Ratio –
Dividend Payout Ratio = Dividend per Share/Earnings per Share
Price Earning Ratio –
P/E Ratio = Market price of a Share/Earnings per Share
A. Short Answer Questions
1. What do you mean by Ratio Analysis?
Ans. Ratio Analysis is a technique of analysis and interpretation of financial statements. It is the process of determining and interpreting numerical relationships based on financial statements. A ratio is an arithmetical expression of the relationship between two accounting figures.
2. What are various types of ratios?
Ans. The various types of ratios are:
- Liquidity Ratios
- Solvency Ratios
- Activity (or Turnover) Ratios
- Profitability Ratios
3. What relationships will be established to study:
Ans. (a) Inventory Turnover – Inventory Turnover Ratio establishes the relationship between Cost of Revenue from Operations (or Cost of Goods Sold) and Average Inventory.
Inventory Turnover Ratio = Cost of Revenue from Operations ÷ Average Inventory
(b) Debtors Turnover – Debtors Turnover Ratio establishes the relationship between Net Credit Revenue from Operations and Average Trade Receivables.
Debtors Turnover Ratio = Net Credit Revenue from Operations ÷ Average Trade Receivables**
(c)Payables Turnover – Payables Turnover Ratio establishes the relationship between Net Credit Purchases and Average Trade Payables.
Payables Turnover Ratio = Net Credit Purchases ÷ Average Trade Payables
(d) Working Capital Turnover – Working Capital Turnover Ratio establishes the relationship between Net Revenue from Operations and Working Capital.
Working Capital Turnover Ratio = Net Revenue from Operations ÷ Working Capital
4. Why would the inventory turnover ratio be more important when analysing a grocery store than an insurance company?
Ans. Inventory Turnover Ratio is more important for a grocery store because inventory constitutes a major part of its current assets and is sold frequently. An insurance company does not deal in inventories. Therefore, this ratio is more relevant for a grocery store than for an insurance company.
5. The liquidity of a business firm is measured by its ability to satisfy its long-term obligations as they become due. Comment.
Ans. The statement is incorrect. Liquidity refers to the ability of a business firm to meet its short-term obligations as they become due. The ability to meet long-term obligations is known as solvency.
6. The average age of inventory is viewed as the average length of time inventory is held by the firm or as the average number of days’ sales in inventory. Explain.
Ans. Average Age of Inventory indicates the average number of days for which inventory remains in the business before it is sold.
It is calculated as:
Average Age of Inventory = 365 Days ÷ Inventory Turnover Ratio
Thus, it represents the average length of time inventory is held by the firm or the average number of days’ sales in inventory.
B. Long Answer Questions
1. Who are the users of financial ratio analysis? Explain the significance of ratio analysis to them.
Ans. The main users of financial ratio analysis are:
(i) Management – Ratio analysis helps management in planning, controlling and decision-making. It helps evaluate operational efficiency and financial performance.
(ii) Investors – Investors use ratio analysis to assess profitability, growth prospects and return on investment before making investment decisions.
(iii) Creditors – Creditors use ratio analysis to determine the firm’s ability to repay debts and meet financial obligations.
(iv) Employees – Employees are interested in the stability and profitability of the enterprise as it affects their job security and future benefits.
(v) Government and Regulatory Authorities – Ratio analysis helps government agencies assess tax liability, compliance with regulations and overall financial health of businesses.
2. What are liquidity ratios? Discuss the importance of current and liquid ratio.
Ans. Liquidity ratios measure the ability of a firm to meet its short-term obligations.
(a) Current Ratio – Current Ratio establishes the relationship between current assets and current liabilities.
Current Ratio = Current Assets ÷ Current Liabilities
Importance:
- Measures short-term solvency.
- Indicates ability to pay current liabilities.
- Helps creditors assess financial soundness.
(b) Liquid Ratio (Quick Ratio) – Liquid Ratio establishes the relationship between liquid assets and current liabilities.
Liquid Ratio = Liquid Assets ÷ Current Liabilities
Importance:
- Measures immediate liquidity position.
- Excludes inventory and prepaid expenses.
- Indicates ability to meet obligations without selling inventory.
3. How would you study the solvency position of the firm?
Ans. The solvency position of a firm can be studied through solvency ratios, which measure the firm’s ability to meet long-term obligations.
Important solvency ratios are:
(i) Debt-Equity Ratio
Debt-Equity Ratio = Debt ÷ Equity
It shows the relationship between outsiders’ funds and shareholders’ funds.
(ii) Total Assets to Debt Ratio
Total Assets to Debt Ratio = Total Assets ÷ Debt
It measures the extent to which debt is covered by assets.
(iii) Proprietary Ratio
Proprietary Ratio = Shareholders’ Funds ÷ Total Assets
It indicates the proportion of total assets financed by owners’ funds.
(iv) Interest Coverage Ratio
Interest Coverage Ratio = EBIT ÷ Interest
It measures the firm’s ability to pay interest on debt.
These ratios collectively indicate the long-term financial stability and solvency of the business.
4. What are important profitability ratios? How are they worked out?
Ans. Profitability ratios measure the ability of a business to earn profits.
Important profitability ratios are:
(i) Gross Profit Ratio
Gross Profit Ratio = Gross Profit ÷ Revenue from Operations × 100
(ii) Operating Ratio
Operating Ratio = (Cost of Revenue from Operations + Operating Expenses) ÷ Revenue from Operations × 100
(iii) Operating Profit Ratio
Operating Profit Ratio = Operating Profit ÷ Revenue from Operations × 100
(iv) Net Profit Ratio
Net Profit Ratio = Net Profit ÷ Revenue from Operations × 100
(v) Return on Investment (ROI)
ROI = EBIT ÷ Capital Employed × 100
These ratios help in evaluating the earning capacity and overall performance of the business.
5. Financial ratio analysis are conducted by four groups of analysts: managers, equity investors, long-term creditors, and short-term creditors. What is the primary emphasis of each of these groups in evaluating ratios?
Ans. Managers – Managers are interested in overall financial performance, efficiency and profitability of the business.
Equity Investors – Equity investors focus on profitability, return on investment and future growth prospects.
Long-term Creditors – Long-term creditors are concerned with the firm’s long-term solvency and ability to repay principal and interest.
Short-term Creditors – Short-term creditors focus on liquidity and the firm’s ability to meet current obligations on time.
6. The current ratio provides a better measure of overall liquidity only when a firm’s inventory cannot easily be converted into cash. If inventory is liquid, the quick ratio is a preferred measure of overall liquidity. Explain.
Ans. Current Ratio considers all current assets, including inventory. Therefore, it provides a broad measure of liquidity.
However, inventory may not always be readily convertible into cash. In such situations, Quick Ratio is a better measure because it excludes inventory and prepaid expenses and considers only liquid assets.
If inventory is highly liquid and can easily be sold for cash, Current Ratio provides a satisfactory measure of liquidity. But when inventory is not easily convertible into cash, Quick Ratio is preferred because it gives a more realistic picture of the firm’s immediate ability to meet current liabilities.
Numerical Questions
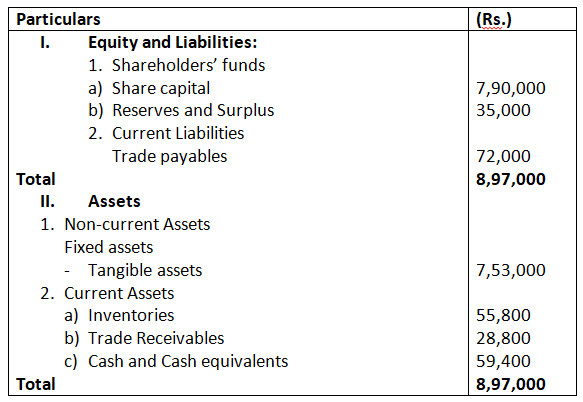
- Following is the Balance Sheet of Raj Oil Mills Limited as on March 31, 2017. Calculate current ratio.
Solution –
Current Assets = Inventories + Trade Receivables + Cash
= 55,800 + 28,800 + 59,400
= 1,44,000
Current Liabilities = 72,000
Current Ratio = Current Assets / current Liabilities
= 1,44,000 / 72,000
= 2/1
Therefore current Ratio = 2 : 1
2. Following is the Balance Sheet of Title Machine Ltd. As on March 31, 2017.
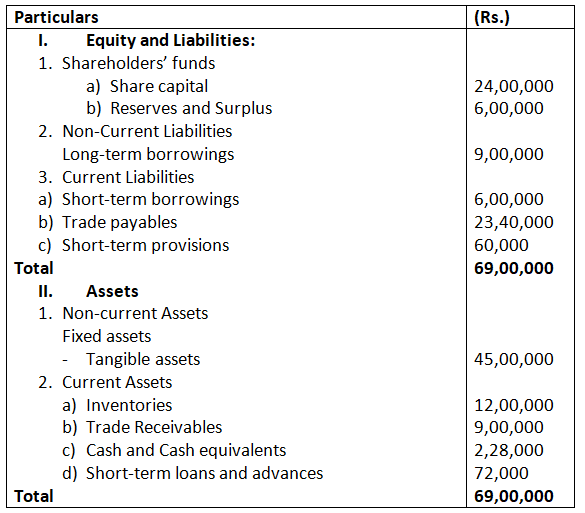
Solution –
Current Assets = Inventories + Trade Receivables + Cash
= 12,00,000 + 9,00,000 + 2,28,000 + 72,000
= 24,00,000
Current Liabilities = Short-term Borrowings + Trade Payables + Short-term provisions.
= 6,00,000 + 23,40,000 + 60,000
= 30,00,000
Current Ratio = Current Assets/current Liabilities
= 24,00,000 / 30,00,000
= 0.8/1
= 0.8 : 1
Liquid Asset = Current Assets – Inventories
= 24,00,000 – 12,00,000
= 12,00,000
Liquid Ratio = 12,00,000 / 30,00,000
= 0.4/1
= 0.4 : 1
3. Current Ratio 3.5 : 1. Working Capital is Rs.90,000. Calculate the amount of current Assets and current liabilities.
Solution –
Working capital = 90,000
Working Capital = CA – CL
= 3.5x – x
= 2.5x
90,000 = 2.5x
X = 90,000/2.5
X = 36,000
Current Liabilities = 36,000
Current Assets = 3.5 x 36,000
= 1,26,000
4. Shine Limited has a current ratio 4.5:1 and quick ratio 3:1; if the stock is 36,000, calculate current liabilities and current assets.
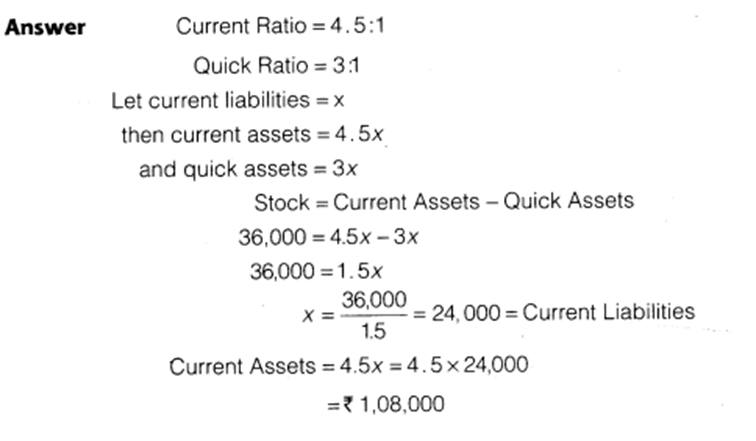
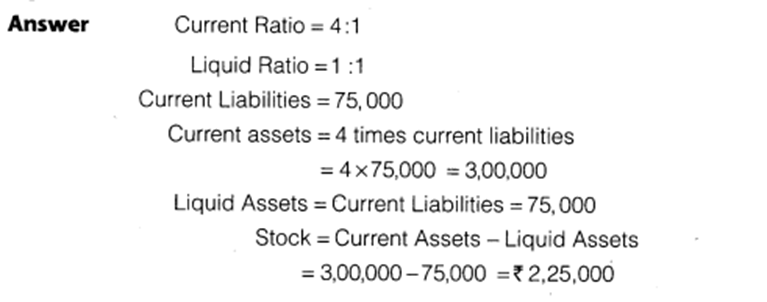
5. Current liabilities of a company are Rs.75,000. If current ratio is 4:1 and liquid ratio is 1:1, calculate value of current assets, liquid assets and stock.
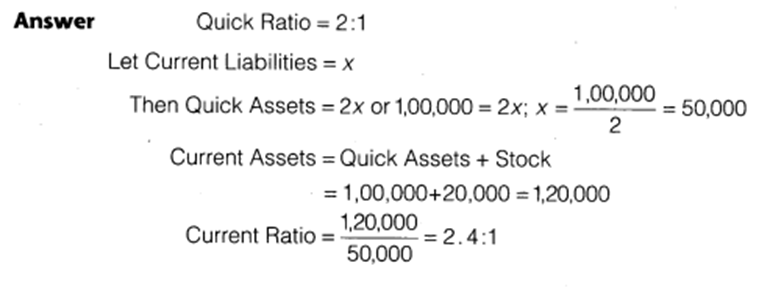
6. Handa Ltd. Has stock of Rs.20,000. Total liquid assets are Rs.1,00,000 and quick ratio is 2:1. Calculate current assets ratio.
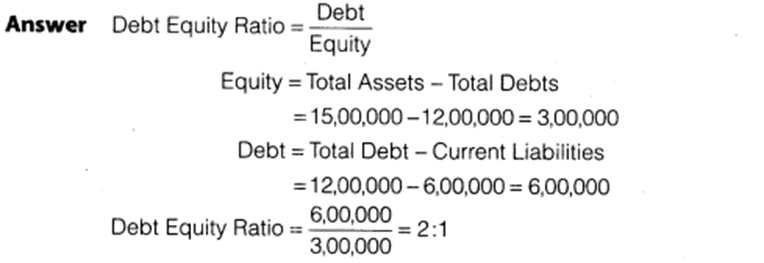
7. Calculate debt equity ratio from the following information:
Total Assets Rs.15,00,000
Current Liabilities Rs.6,00,000
Total Debts Rs.12,00,000
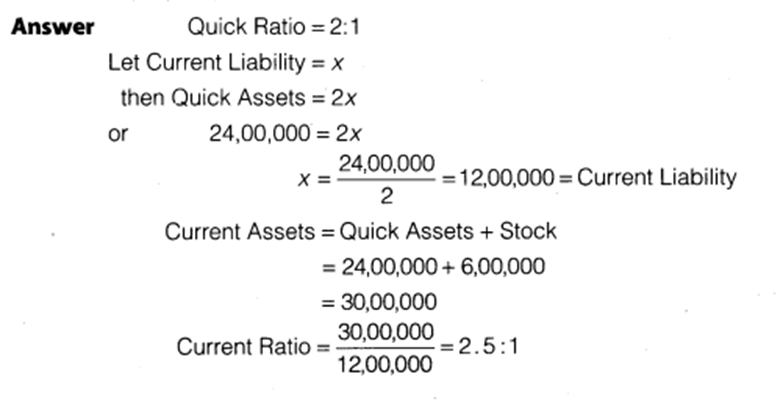
8. Calculate Current Ratio if:
Stock is Rs.6,00,000; Liquid Assets Rs.24,00,000; Quick Ratio 2:1.
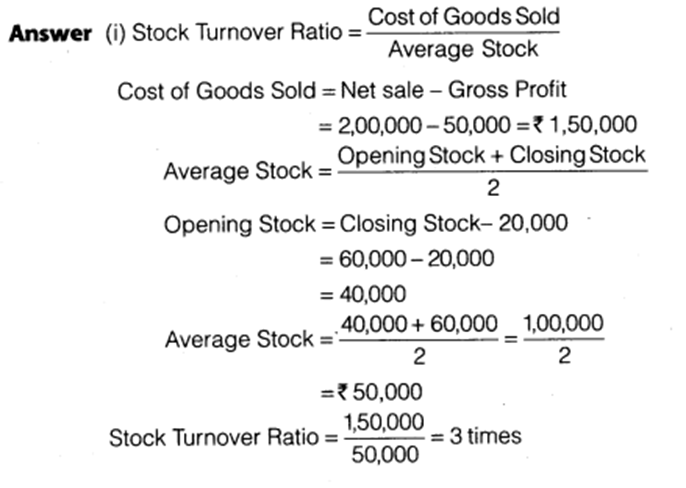
9. Compute Stock Turnover Ratio from the following information:
Net Sales Rs.2,00,000
Gross Profit Rs.50,000
Closing Stock Rs.60,000
Excess of Closing Stock over opening Stock Rs.20,000
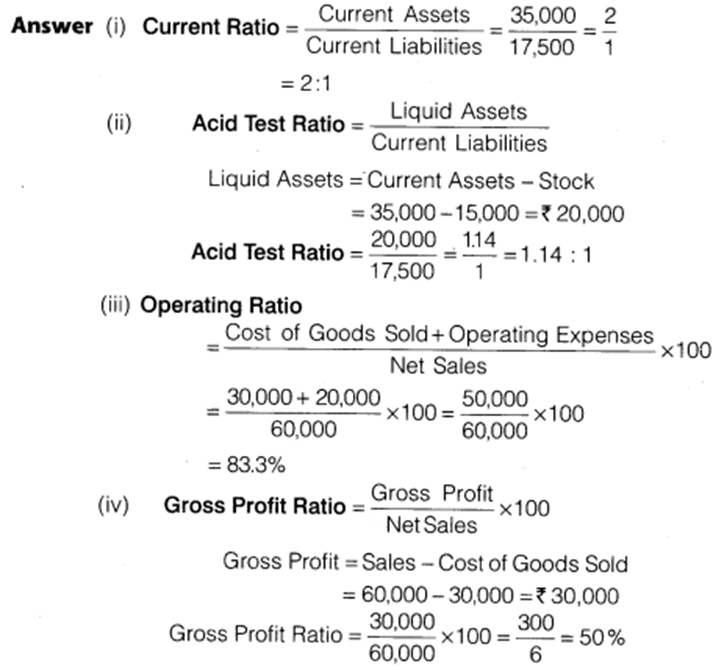
10. Calculate following ratios from the following information:
- Current ratio
- Acid test ratio
- Operating Ratio
- Gross Profit Ratio
Current Assets Rs.35,000
Current Liabilities Rs.17,500
Stock Rs.15,000
Operating Expenses Rs.20,000
Sales Rs.60,000
Cost of Goods Sold Rs.30,000
Note (i) Acid test ratio, quick ratio and liquid ratio are one and the same.
(ii) Students mostly get confused in operating ratio and operating profit ratio, so be careful while doing these ratios.
11. From the Following information calculate:
- Gross Profit Ratio
- Inventory Turnover Ratio
- Current Ratio
- Liquid Ratio
- Net Profit Ratio
- Working capital Ratio:
Sales Rs.25,20,000
Net Profit Rs.3,60,000
Cast of Sales Rs.19,20,000
Long-term Debt Rs.9,00,000
Creditors Rs.2,00,000
Average Inventory Rs.8,00,000
Current Assets Rs.7,60,000
Fixed Assets Rs.14,40,000
Current Liabilities Rs.6,00,000
Net Profit before interest and tax Rs.8,00,000
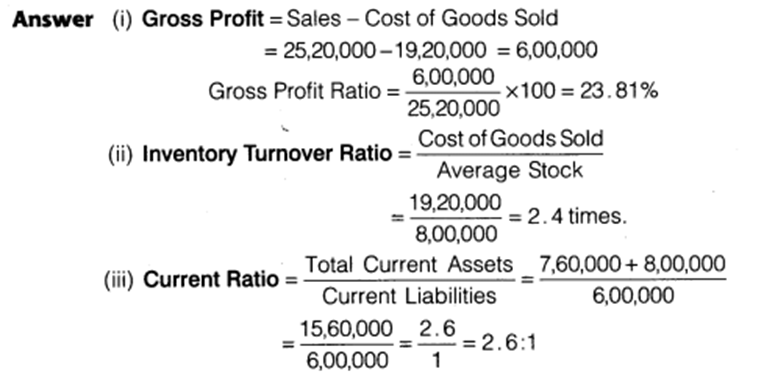
Note: in the question stock in given separately from current assets, hence it is added to make total current assets.
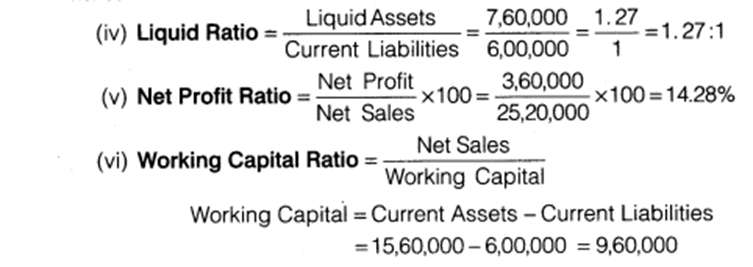
Note: In this question current assets should be considered as other current asset and stock in separate, in other words, other current assets means liquid assets. Working capital ratio and working capital turnover ratio means same.
12. Compute Working Capital Turnover Ratio. Debt Equity Ratio and Proprietary Ratio from the following information:
Paid-up Capital Rs.5,00,000
Current Assets Rs.4,00,000
Net Sales Rs.10,00,000
13% Debentures Rs.2,00,000
Current Liability Rs.2,80,000
Solution –
Working Capital = 4,00,000 – 2,80,000
= 1,20,000
Working capital turnover ratio = 10,00,000 / 1,20,000
= 8.333
Debt-equity ratio = 2,00,000/5,00,000
= 0.4 : 1
Total Asset = Shareholder’ funds + Long term debt + current liabilities
= 5,00,000 + 2,00,000 + 2,80,000
= 9,80,000
Proprietary Ratio = 5,00,000 / 9,80,000
= 0.51 : 1
Proprietary ratio = 5,00,000 / 7,00,000
= 0.71 : 1
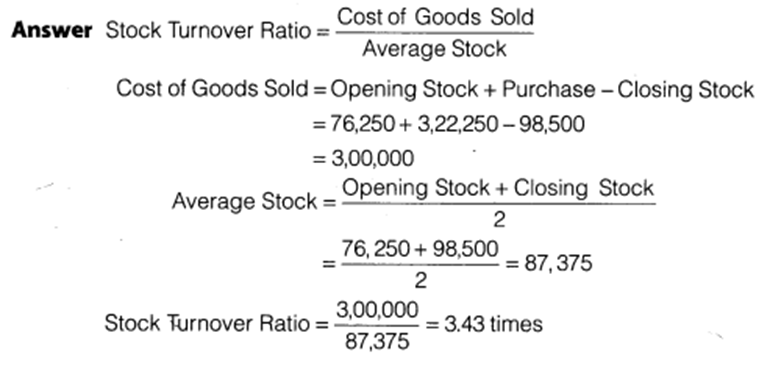
13. Calculate stock Turnover Ratio If:
Opening stock is Rs.76,250
Closing Stock is Rs.98,500
Sales is Rs.5,20,000
Sales Return is Rs.20,000
Purchases is Rs.3,22,250.
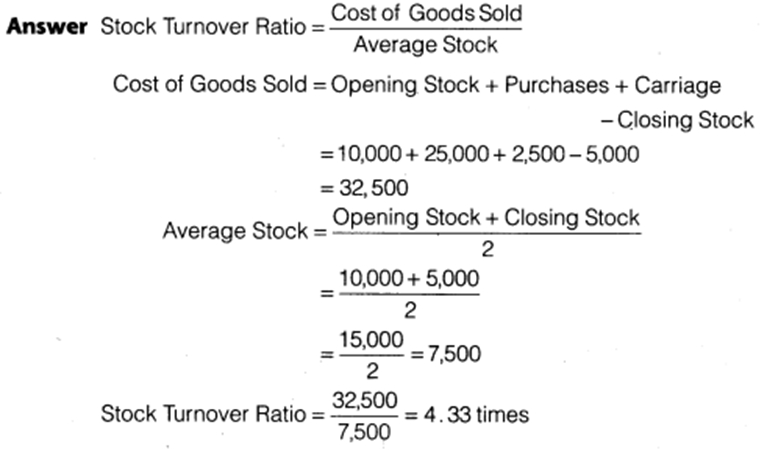
14. Calculate Stock Turnover Ratio from the data given below:
Stock at the beginning of the year Rs.10,000
Stock at the end of the year Rs.5,000
Carriage Rs.2,500
Sales Rs.50,000
Purchases Rs.25,000
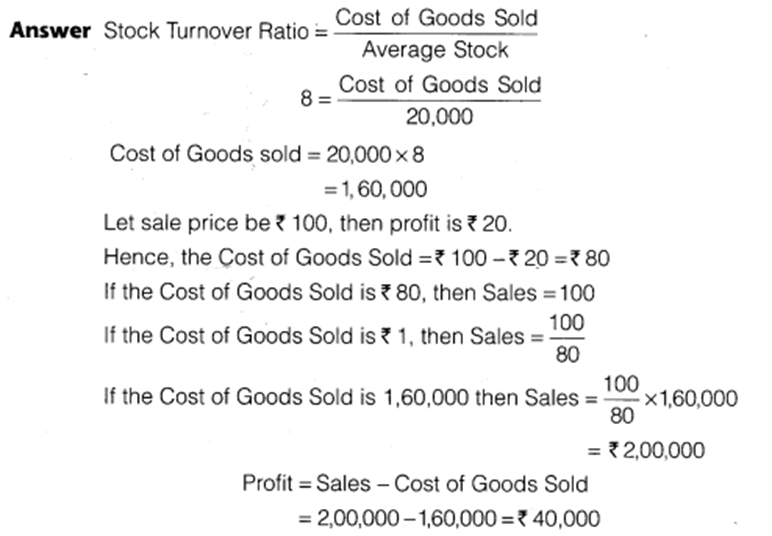
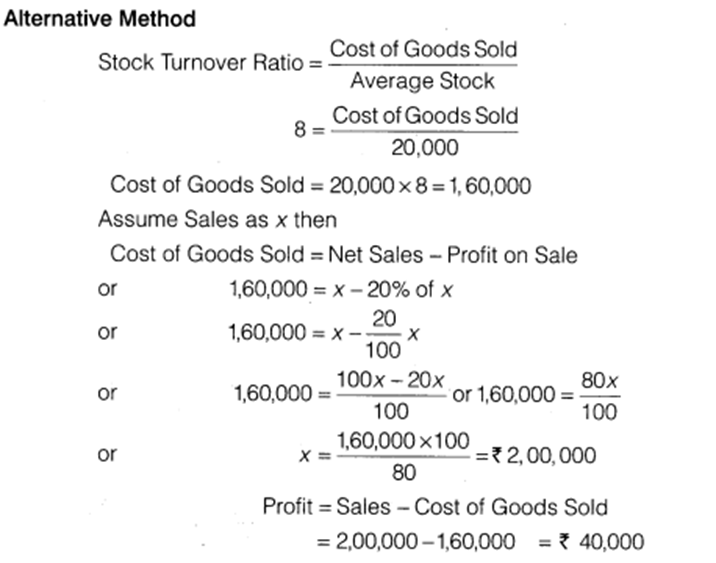
15. A trading firm’s average stock is Rs.20,000 (cost). If the stock turnover ratio is 8 times and the firm sells goods at a profit of 20% on sale, ascertain the profit of the firm.
16. You are able to collect the following information about a company for two years:
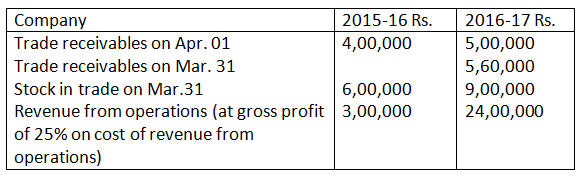
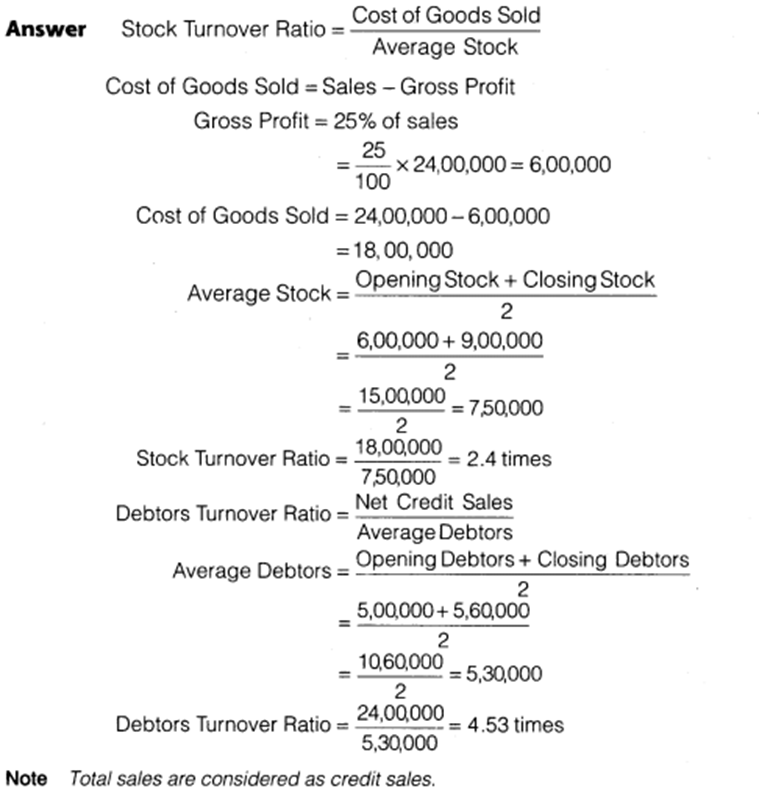
Calculate stock Turnover Ratio and Debtor Turnover Ratio if in the year 2004 stock in trade increased by Rs.2,00,000.
17. The following Balance Sheet and other information, calculate following ratios:
- Debt Equity Ratio
- Working Capital Turnover Ratio
- Debtors Turnover Ratio
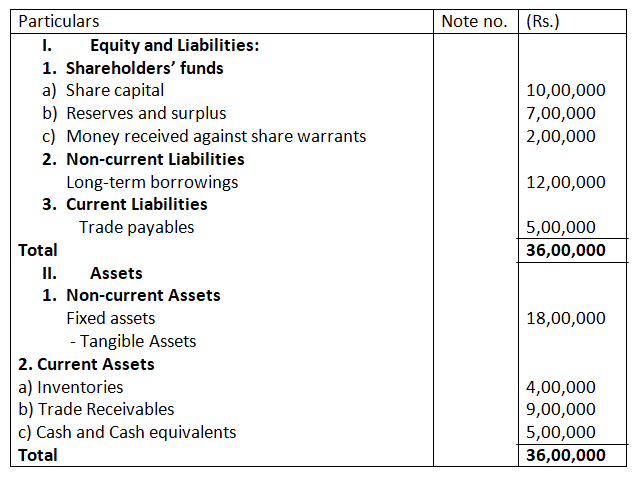
Additional information: Revenue from Operations Rs.18,00,000
Solution –
Shareholders’ Funds = Share Capital + Reserves and Surplus + Money received against Share Warrants
= 10,00,000 + 7,00,000 + 2,00,000
= 19,00,000.
Debt-Equity Ratio = Long-term Debt Shareholders’ Funds
= 12,00,000 19,00,000
= 0.63 : 1
Current Assets = 4,00,000 + 9,00,000 + 5,00,000 = 18,00,000.
Working Capital = CA − CL
= 18,00,000 − 5,00,000
= 13,00,000.
Working Capital Turnover Ratio = 18,00,000 13,00,000
= 1.38 times
Trade Receivables Turnover Ratio = 18,00,000 9,00,000
= 2 times.
18. From the following information, calculate the following ratios:
- Liquid Ratio
- Inventory turnover ratio
- Return on investment
Rs.
Inventory in the beginning 50,000
Inventory at the end 60,000
Net Profit 2,17,900
10% Debentures 2,50,000
Revenue from operations 4,00,000
Gross Profit 1,94,000
Cash and Cash Equivalents 40,000
Money received against share warrants 20,000
Trade Receivables 1,00,000
Trade Payables 1,90,000
Other Current Liabilities 70,000
Share Capital 2,00,000
Reserves and Surplus 1,20,000
(Balance in the Statement of Profit & Loss)
Solution –
Current Liabilities = 1,90,000 + 70,000
= 2,60,000.
Liquid (Quick) Assets = 40,000 + 1,00,000
= 1,40,000.
Liquid Ratio. Liquid Ratio = 1,40,000 2,60,000
= 0.54 : 1.
Cost of Revenue from Operations = 4,00,000 − 1,94,000 = 2,06,000
Average Inventor = (50,000 + 60,000)/2
= 55,000.
Inventory Turnover Ratio = 2,06,000 55,000
= 3.75 times.
Interest on Debentures. Interest = 10% × 2,50,000
= 25,000.
Profit before Interest and Tax = Net Profit + Interest
= 2,17,900 + 25,000
= 2,42,900.
Capital Employed = 2,00,000 + 1,20,000 + 20,000 + 2,50,000
= 5,90,000.
Return on Investment = 2,42,900 5,90,000 × 100
= 41.17%.
19. From the following, calculate (a) Debt Equity Ratio (b) Total Assets to Debt Ratio (c) Proprietary Ratio.
Equity Share Capital Rs.75,000
Share application money pending allotment Rs.25,000
General Reserve Rs.45,000
Balance in the statement of Profits & Loss Rs.30,000
Debentures Rs.75,000
Sundry Creditors Rs.40,000
Outstanding Expenses Rs.10,000
Solution –
Shareholders’ Funds = 75,000 + 25,000 + 45,000 + 30,000
= 1,75,000.
Long-term Debt+ = 75,000 (Debentures).
Current Liabilities = 40,000 + 10,000
= 50,000.
Total Assets = 1,75,000 + 75,000 + 50,000
= 3,00,000.
Debt-Equity Ratio = 75,000/ 1,75,000
= 0.43 : 1.
Total Assets to Debt Ratio = 3,00,000 /75,000
= 4 : 1.
Proprietary Ratio. Proprietary Ratio = 1,75,000/ 3,00,000
= 0.58 : 1.
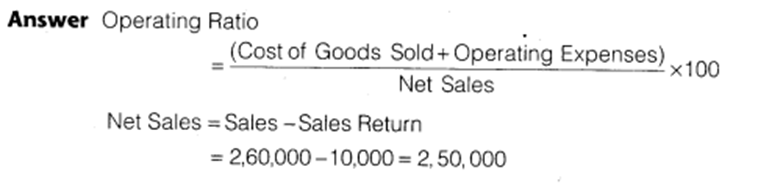
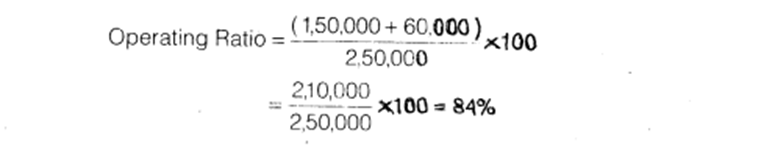
20. Cost of Goods Sold is Rs.1,50,000. Operating expenses are Rs.60,000. Revenue from Operations is Rs.2,50,000. Calculate Operating Ratio.
21. Calculate the following ratio on the basis of following information:
- Gross Profit Ratio (ii) Current Ratio (iii) Acid Test Ratio (iv) Inventory Turnover Ratio (v) Fixed Assets Turnover Ratio
Rs.
Gross Profit 50,000
Revenue from Operations 1,00,000
Inventory 15,000
Trade Receivables 27,500
Cash and Cash Equivalents 17,500
Current Liabilities 40,000
Land & Building 50,000
Plant & Machinery 30,000
Furniture 20,000
Solution –
Gross Profit Ratio = 50,000/ 1,00,000 × 100
= 50%.
Current Assets = 15,000 + 27,500 + 17,500
= 60,000.
Current Ratio = 60,000 /40,000
= 1.5 : 1.
Liquid Assets = CA − Inventory
= 60,000 − 15,000 = 45,000.
Acid Test (Quick) Ratio = 45,000 /40,000
= 1.125 : 1.
Cost of Revenue from Operations = 1,00,000 − 50,000
= 50,000.
Inventory Turnover Ratio = 50,000/ 15,000
= 3.33 times.
Fixed Assets = 50,000 + 30,000 + 20,000
= 1,00,000.
Fixed Assets Turnover Ratio = 1,00,000/ 1,00,000
= 1 : 1.
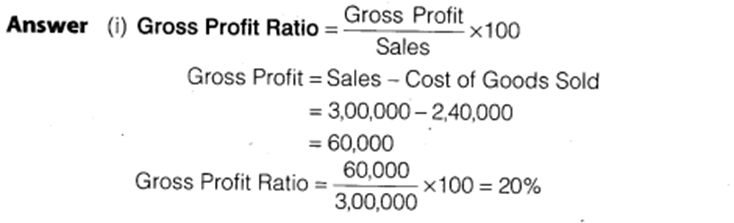
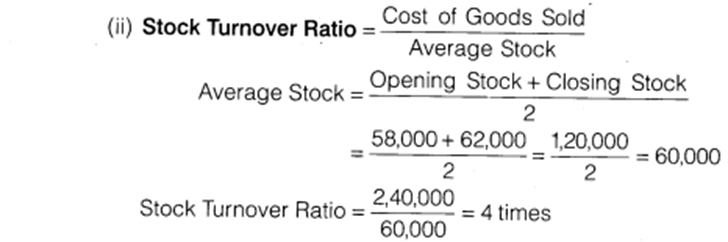
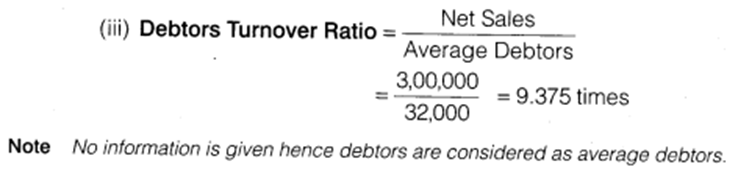
22. From the following information calculate Gross profit ratio. Stock Turnover Ratio and Debtors Turnover Ratio
Revenue from Operation Rs.3,00,000
Cost of Revenue from operations Rs.2,40,000
Inventory at the end Rs.62,000
Gross Profit Rs.60,000
Inventory in the beginning Rs.58,000
Debtors Rs.32,000