Introduction
The concepts of demand and supply help us to understand the motivations and actions of people in their roles as consumers and producers. However, these concepts are of limited use when they are taken separately. They become more useful when they are used together to explain the behavior of equilibrium in the market. So, a market consists of three elements:
- Demand, describing the behavior of consumers in the market.
- Supply, describing the behavior of firms in the market.
- Market Equilibrium, connecting demand and supply and describing how consumers and producers interact in the market.
Determination of Market Equilibrium Under Perfect Competition
As discussed before, perfect competition is a market structure where each firm is a price-taker and price is determined by the market forces of demand and supply. We know that equilibrium refers to a state of balance. It means, under perfect competition, market equilibrium is determined when market demand is equal to market supply.
Let us recall the concept of market demand and market supply:
- Market demand is the sum total of demand for a commodity by all the buyers in the market. Its curve slopes downwards due to the operation of the law of demand.
- Market supply is the sum total of supplies of a commodity by all the producers in the market. Its curve slopes upwards due to the operation of the law of supply.
Why any other price is not the Equilibrium Price?
- Any price above Rs.6 is not the equilibrium price as the resulting surplus, i.e. excess supply, would cause competition among sellers. In order to sell the excess stock, the price would come down to the equilibrium price of Rs.6.
- Any price below Rs.6 is also not the equilibrium price as due to excess demand, buyers would be ready to pay higher prices to meet demand. As a result, price would rise upto the equilibrium price of Rs.6.
Excess Demand – Excess demand refers to a situation when the quantity demanded is more than the quantity supplied at the prevailing market price. Under this situation, the market price is less than the equilibrium price. Excess demand occurs at prices market supply. Let us understand the concept of excess demand.
Excess Supply – Excess supply refers to a situation, where the quantity supplied is more than the quantity demanded at the prevailing market price. Under this situation, the market price is more than the equilibrium price. Excess supply occurs at prices of Rs.8 and Rs.10, when market supply is more than market demand. If market price is OP1 then market supply of OQ1 is more than market demand of OQ2. This situation is termed as excess supply.
Viable and Non-Viable Industry
Viable Industry – Viable industry refers to an industry for which supply curve and demand curve intersect each other in positive axes. In the viable industry, supply and demand curves must intersect at some positive point as shown in. As seen in the given diagram, both demand and supply curves intersect each other in the positive range of X-axis and Y-axis.
Non-viable Industry – Non-viable industry refers to an industry for which supply curve and demand curve never intersect each other in the positive axes. In a non-viable industry, the supply curve lies above the demand curve as price is too high for the consumers. It happens when the price, at which producers are ready to produce, is so high that consumers are not willing to buy even a single unit. As a result, the product is not produced.
Effects of Changes in Demand and Supply On Market Equilibrium in Short Run
As discussed, equilibrium price and equilibrium quantity are determined when the quantity demanded is equal to the quantity supplied. So, if there is any change which leads to a shift in either the demand curve or supply curve or both, then the equilibrium price and equilibrium quantity are bound to change. Demand and Supply, we studies the various reasons for the shift in the demand curve and supply curve. Let us first revise them before we proceed.
Change in Demand
Change in demand or shift in the demand curve occurs due to change in any of the factors that where assumed constant under the law of demand. The change may be either an ‘Increase in Demand’ or ‘Decrease in Demand’
- Increase in Demand – An increase in demand (assuming no change in supply) leads to a rightward shift in the demand curve from DD to D1D1.
- Decrease in Demand – In case of a decrease in demand (supply remaining unchanged), the demand curve shifts to the left from DD to D2D2. When demand decrease to D2D2, it creates an excess supply at the old equilibrium price of OP.
Change in Bothe Demand and Supply
Demand and Supply model is very easy to use when there is a change in either demand or supply. However, in reality, there are a number of situation which lead to simultaneous changes in both demand and supply. To predict whether the equilibrium price and the equilibrium quantity rise or fall in such cases, we need to know the magnitude of changes in both demand and supply.
(i) Both Demand and Supply Decrease – original Equilibrium is determined at point E when the original demand curve DD and the original supply curve SS intersect each other. OQ is the equilibrium quantity and OP is the equilibrium price.
Case 1 – Decrease in Demand = Decrease in Supply
When a decrease in demand is proportionately equal to the decrease in supply, then the leftward shift in the demand curve from DD to D1D1 is proportionately equal to the leftward shift in the supply curve from SS to S1S1. The new equilibrium is determined at E1. As demand and supply decrease in the same proportion, the equilibrium price remains same at OP, but the equilibrium quantity falls from OQ to OQ1.
Case 2 – Decrease in Demand > Decrease in Supply
When a decrease in demand is proportionately more than the decrease in supply, then the leftward shift in the demand curve from DD to D1D1 is proportionately more than leftward shift in the supply curve from SS to S1S1. The new equilibrium is determined at E1, the equilibrium price falls from OP to OP1 and the equilibrium quantity falls from OQ to OQ1.
Case 3 – Decrease in Demand < Decrease in Supply
When a decrease in demand is proportionately less than the decrease in supply, then the leftward shift in the demand curve from DD to D1D1 is proportionately less than a leftward shift in the supply curve from SS to S1S1. The new equilibrium is determined at E1, the whereas, equilibrium quantity falls from OQ to OQ1.
(ii) Both Demand and Supply Increase – Original Equilibrium is determined at point E when the original demand curve DD and the original supply curve SS intersect each other. OQ is the equilibrium quantity and OP is the equilibrium price.
Case 1 – Increase in Demand = Increase in Supply
When an increase in demand is proportionately equal to the increase in supply, then a rightward shift in demand curve from DD to D1D1 is proportionately equal to a rightward shift in the supply curve from SS to S1S1. The new equilibrium is determined at E1. As both demand and supply increase in the same proportion, equilibrium price remains the same at OP, but equilibrium quantity rises from OQ to OQ1.
Case 2 – Increase in Demand > Increase in Supply
When an increase in demand is proportionately more than the increase in supply, then a rightward shift in demand curve from DD to D1D1 is proportionately more than a rightward shift in the supply curve from SS to S1S1. The new equilibrium is determined at E1, equilibrium price rises from OP to OP1 and equilibrium quantity rises from OQ to OQ1.
Case 3 – Increase in Demand < Increase in Supply
When increase in demand is proportionately less than increase in supply, then rightward shift in demand curve from DD to D1D1 is proportionately less than rightward shift in supply curve from SS to S1S1. The new equilibrium is determined at E1, equilibrium price falls from OP to OP1 whereas, equilibrium quantity rises from OQ to OQ1.
(iii) Demand Decrease and Supply Increase – The effect of a simultaneous decrease in demand and increase in supply on equilibrium price and equilibrium quantity is analysed in the in the following three cases:
Case 1 – Decrease in Demand = Increase in Supply
When a decrease in demand is proportionately equal to increase in supply, then the leftward shift in the demand curve from DD to D1D1 is proportionately equal to rightward shift in supply curve from SS to S1S1. The new equilibrium quantity remains the same at OQ, but equilibrium price falls from OP to OP1.
Case 2 – Decrease in Demand > Increase in Supply
When a decrease in demand is proportionately more than increase in supply, then the leftward shift in the demand curve from DD to D1D1 is proportionately more than the rightward shift in supply curve from SS to S1S1. The new equilibrium is determine at E1, equilibrium quantity fall from OQ to OQ1 and equilibrium price falls from OP to OP1.
Case 3 – Decrease in Demand < Increase in Supply
When a Decrease in demand is proportionately less than the increase in supply, then the leftward shift in the demand curve from DD to D1D1 is proportionately less than rightward shift in the supply curve from SS to S1S1. The new equilibrium is determined at E1, equilibrium quantity rises from OQ to OQ1 whereas, equilibrium price falls from OP to OP1.
(iv) Demand Increase and supply Decrease – The effect of an increase in demand and a decrease in supply on equilibrium price and equilibrium quantity is discussed in the following three cases:
Case 1 – Decrease in Demand = Increase in Supply
When an increase in demand is proportionately equal to a decrease in supply, then the rightward shift in the demand curve from DD to D1D1 is proportionately equal to the leftward shift in the supply curve from SS to S1S1. The new equilibrium is determined at E1. As the increase in demand is proportionately equal to the decrease in supply, equilibrium quantity remains the same at OQ, but equilibrium price rises from OP to OP1.
Case 2 – Increase in Demand > Decrease in Supply
When an increase in demand in proportionately more than the decrease in supply, then the rightward shift in the demand curve from DD to D1D1 is proportionately more than leftward shift in the supply curve from SS to S1S1. The new equilibrium is determined at E1. As the increase in demand is proportionately more than the decrease in supply, equilibrium quantity rises from OQ to OQ1 and equilibrium price rises from OP to OP1.
Case 3 – Decrease in Demand < Increase in Supply
When an increase in demand is proportionately less than decrease in supply, then the rightward shift in the demand curve from DD to D1D1 is proportionately less than a leftward shift in the supply curve from SS to S1S1. The new equilibrium is determined at E1. As the increase in demand is proportionately less than the decrease in supply, equilibrium quantity falls from OQ to OQ1 whereas, equilibrium price rise from OP to OP1.
Special Cases
(i) Change in Demand when supply is perfectly Elastic – When supply is perfectly elastic, then a change in demand does not affect the equilibrium price of the commodity. It only changes the equilibrium quantity. Original Equilibrium is determined at point E, when the original demand curve DD and the perfectly elastic supply curve SS intersect each other. OQ is the equilibrium quantity and OP is the equilibrium price.
- Increase in Demand – When demand increase, the demand curve shifts to the right from DD to D1D1. Supply curve SS is a horizontal straight curve SS is a horizontal straight line parallel to the X-axis. Due to the increase in demand for the product, the new equilibrium is established at E1. Equilibrium quantity rises from OQ to OQ1 but equilibrium price remains the same at OP as supply is perfectly elastic.
- Decrease in Demand – When demand decreases, the demand curve shifts to the left from DD to D2D2. Supply curve SS is a horizontal straight line parallel to the X-axis. Due to a decrease in demand, the new equilibrium is established at E2. Equilibrium quantity falls from OQ to OQ2 but equilibrium price remains the same at OP as supply is perfectly elastic.
(ii) Change in Supply when Demand is Perfectly Elastic – When demand is perfectly elastic, then a change in supply does not affect the equilibrium price of the commodity. It only changes the equilibrium quantity. Original Equilibrium is determined at point E when the perfectly elastic demand curve DD and the original supply curve SS interest each other. OQ is the equilibrium quantity and OP is the equilibrium price.
- Increase in Supply – When supply increases, the supply curve shifts to the right from SS to S1S1. Demand curve DD is a horizontal straight line parallel to the X-axis. Due to an increase in supply for the product, the new equilibrium is established at E1. Equilibrium quantity rises from OQ to OQ1 but equilibrium price remains the same at OP as demand is perfectly elastic.
- Decrease in Supply – When supply decreases, the supply curve shifts to the left from SS to S2S2. Demand curve DD is a horizontal straight line parallel to the X-axis. Due to a decrease in supply for the product, the new equilibrium is established at E2. Equilibrium quantity falls from OQ to OQ2 but equilibrium price remains the same at OP due to perfectly elastic demand.
(iii) Change in Demand when Supply is Perfectly Inelastic – when supply is perfectly inelastic, then a change in demand does not affect the equilibrium quantity. It only changes the equilibrium price. The change may be either an ‘Increase in Demand’ or ‘Decrease in Demand’.
- Increase in Demand – When demand increase, the demand curve shifts to the right from DD to D1D1. Supply curve SS is a vertical straight line parallel to the Y-axis. Due to the increase in demand for the product, the new equilibrium is established at E1. Equilibrium price rises from OP to OP1 but equilibrium quantity remains the same at OQ as supply is perfectly inelastic.
- Decrease in Demand – When demand decrease, the demand curve shifts to the left from DD to D2D2. Supply curve SS is a vertical straight line parallel to the Y-axis. Due to decrease in demand, the new equilibrium is established at E2. Equilibrium price falls from OP to OP2 but equilibrium quantity remains the same at OQ as the supply is perfectly inelastic.
(iv) Change in Supply when Demand is Perfectly Inelastic – When demand is perfectly inelastic, then a change in supply does not affect the equilibrium quantity. It only changes the equilibrium price. The change may be either an ‘Increase in Supply’ or ‘Decrease in Supply’.
- Increase in Supply – When supply increase, the supply curve shifts to the right from SS to S1S1. Demand curve DD is a vertical straight line parallel to the Y-axis. Due to the increase in supply for the product, the new equilibrium is established at point E1. Equilibrium price falls from OP to OP1 but equilibrium quantity remains the same at OQ as demand is perfectly inelastic.
- Decrease in Supply – When supply decrease, the supply curve shifty to the left from SS to S2S2. Demand curve DD is a vertical straight line parallel to the Y-axis. Due to a decrease in supply for the product, the new equilibrium is established at point E2. Equilibrium price rises from OP to OP2 but equilibrium quantity remains the same at OQ as demand is perfectly inelastic.
Simple application of Tools of Demand and Supply – Markets are rarely free from government interference. At times, the government has to intervene in the process of price determination when the equilibrium price so determined is either too high for the consumers or too low (i.e. unprofitable) for the producers of the commodity. Let us now discuss the two types of government interventions:
- Price Ceiling or Maximum Price Ceiling
- Price Floor or Minimum Support Price (MSP)
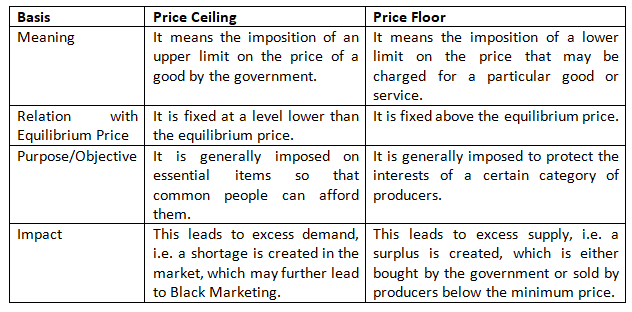
Price Ceiling Or Maximum Price ceiling – The government plays an important role in controlling the prices of essential commodities (wheat, sugar, kerosene, etc.) when the equilibrium price determined by free play of demand and supply in too high for the poor people. Price Ceiling refers to fixing the maximum price of a commodity at a level lower than the equilibrium price.
Need for Price Ceiling – It is generally imposed on essential items and is fixed below the equilibrium price or market determined price. The reason for the price ceiling is that the equilibrium price is too high for the common people to afford.
Consequences of Price Ceiling
- Black Marketing – Black Market is any market in which the commodities are sold at a price higher than the maximum price fixed by the government. Black marketing may be termed as direct consequence or implication of price ceiling as it implies a situation where the commodity under the government.
- Rationing System – To meet the excess demand, the government may also enforce the ‘Rationing System’.
- Rationing is a technique adopted by the government to sell a minimum quato of essential commodities at a price less than the equilibrium price to supply goods to the poor community at a cheaper price. Under the system, consumers are given ration cards / coupons to buy commodities at a cheaper price from ration shops.
- Difficulty in obtaining goods from ration shops – consumers have to stand in long to stand in long queues to buy goods from ration shops. Sometime, commodities are not available in the ration shops or goods are of inferior quality.
3. Dual Price Policy – Government may also allow a system of having two prices for the same product at the same time to avoid the situation of black marketing. Under this system, a fixed quantity of the product is supplied to consumers at a lower price through fair price shops and at the same time, the product is also made available in the open market at the market price determined by market forces of demand and supply.
Price Floor or Minimum Support Price (MSP)
The government also intervenes in the process of price determination through the Price Floor. Price Floor refers to the minimum price (above the equilibrium price), fixed by the government, which the producers must be paid for their produce. Price Floor or Minimum Price Ceiling refers to imposition of lower limit on the price that may be charged for a particular good or service.
Need for Price Floor – The need for price floor arises when the government finds that the equilibrium price is too low for the producers.
- Most well-known examples of imposition of Price Floor are agricultural price support programmes and minimum wage legislation.
- Indian Government maintains a variety of minimum support price programmes for various agricultural products like wheat, sugarcane, etc., and the floor is normally set at a level higher than the market determined price for these goods.
Difference between Price Ceiling and Price Floor
Short Answer Type Questions
- Define the following terms: (a) Equilibrium; (b) Equilibrium price; (c) Equilibrium quantity; (d) Market equilibrium.
Answer –
(a) Equilibrium – Equilibrium is a situation in which quantity demanded is equal to quantity supplied at a particular price. There is neither excess demand nor excess supply.
(b) Equilibrium Price – Equilibrium price is the price at which market demand equals market supply. It is also known as the market-clearing price.
(c) Equilibrium Quantity – Equilibrium quantity is the quantity of a commodity bought and sold in the market at the equilibrium price.
(d) Market Equilibrium Market equilibrium is the situation in which market demand and market supply are equal, resulting in a stable market price.
2. Explain the process of price determination under perfect competition with the help of a schedule and a diagram.
Answer – Under perfect competition, price is determined by the interaction of market demand and market supply.
- If demand is greater than supply, price rises.
- If supply is greater than demand, price falls.
- Equilibrium is reached where quantity demanded equals quantity supplied (QD = QS).
- The corresponding price is called the equilibrium price, and the corresponding quantity is called the equilibrium quantity.
3. Explain the concept of a non-viable industry with the help of an example.
Answer – A non-viable industry is one in which the market price is less than the Average Variable Cost (AVC). In such a case, firms cannot recover even their variable costs and stop production in the short run.
Example: If the market price is ₹20 and AVC is ₹25, firms will shut down because Price < AVC.
4. What is meant by viable industry? Explain with the help of a diagram.
Answer – A viable industry is an industry in which the market price is equal to or greater than the Average Variable Cost (AVC). Firms are able to recover their variable costs and continue production in the short run.
Condition: Price ≥ AVC
5. Explain the chain of effects of an increase in the supply of a commodity on its equilibrium price.
Answer – An increase in supply shifts the supply curve to the right.
- Supply increases.
- Excess supply arises at the existing price.
- Sellers reduce the price.
- Quantity demanded increases.
- A new equilibrium is established.
6. Briefly discuss the effect on equilibrium price and quantity, when decrease in supply is more than the decrease in demand.
Answer – When the decrease in supply is greater than the decrease in demand, the supply curve shifts leftward more than the demand curve.
- Equilibrium price increases because the shortage of the commodity is relatively greater.
- Equilibrium quantity decreases because both demand and supply decline.
7. Explain the chain effects on demand, supply and price of a commodity caused by a leftward shift of a demand curve. Use diagram.
Answer – A leftward shift of the demand curve indicates a decrease in demand.
Chain of Effects:
- Demand decreases.
- At the existing price, excess supply arises.
- Sellers reduce the price to clear their stock.
- Quantity supplied decreases.
- A new equilibrium is established.
8. How will an increase in the income of the buyers of an ‘inferior good’ affect its equilibrium price and equilibrium quantity? Explain with the help of a diagram.
Answer – For an inferior good, an increase in consumers’ income reduces its demand.
- Demand curve shifts leftward.
- Excess supply arises at the existing price.
- Price falls.
- Quantity supplied adjusts downward.
- A new equilibrium is established.
9. Discuss the effect on equilibrium price and equilibrium quantity, when: (a) Supply is perfectly elastic and demand increase (b) Demand is perfectly inelastic and supply decrease
Answer –
(a) Supply is perfectly elastic and demand increases
When supply is perfectly elastic, the supply curve is horizontal.
- Increase in demand raises only the equilibrium quantity.
- Equilibrium price remains unchanged.
(b) Demand is perfectly inelastic and supply decreases
When demand is perfectly inelastic, the demand curve is vertical.
- Decrease in supply raises the equilibrium price.
- Equilibrium quantity remains unchanged.
10. Explain the changes that will take place in the market for a commodity if the prevailing market price is less than the equilibrium price.
Answer – If the market price is below the equilibrium price:
- Quantity demanded exceeds quantity supplied.
- Excess demand (shortage) arises.
- Buyers compete to purchase the commodity.
- Sellers increase the price.
- Price continues to rise until equilibrium is restored.
11. How is the equilibrium price of a commodity affected by a rise in the price of its substitutes? Explain the chain of effects.
Answer – When the price of a substitute rises, consumers shift their demand towards the given commodity.
Chain of Effects:
- Demand for the commodity increases.
- Demand curve shifts rightward.
- Excess demand arises.
- Sellers increase the price.
- Supply increases until a new equilibrium is reached.
12. Cigarette smoking is injurious to health. How can the government reduce its consumption but only through normal market forces? Explain the chain of effects of the government’s action.
Answer – The government can impose a tax on cigarettes.
Chain of Effects:
- Tax increases the cost of production.
- Supply of cigarettes decreases.
- Supply curve shifts leftward.
- Equilibrium price increases.
- Equilibrium quantity decreases.
- As the price rises, cigarette consumption falls.
13. Market for an essential item of consumption is in equilibrium, but the equilibrium price is too high for the common man. What can the government do to bring down the market price but only through the normal market forces? Explain the chain of effect of the government’s action.
Answer – The government can provide subsidy to producers.
Chain of Effects:
- Subsidy reduces the cost of production.
- Supply increases.
- Supply curve shifts rightward.
- Equilibrium price falls.
- Equilibrium quantity increases.
14. What is meant by ‘Price Ceiling’? Explain using a suitable example.
Answer – Price Ceiling is the maximum price fixed by the government above which a commodity cannot be sold.
Example: The government may fix a maximum price for essential medicines or LPG cylinders to protect consumers from high prices.
15. Explain the effect of a ‘Price Ceiling’.
Answer – When the government fixes a price ceiling below the equilibrium price:
- Quantity demanded increases.
- Quantity supplied decreases.
- Excess demand (shortage) arises.
- Consumers may face scarcity and rationing.
16. Explain the effect of a ‘Price Floor’.
Answer – A Price Floor is the minimum price fixed by the government above the equilibrium price.
Effects:
- Quantity supplied increases.
- Quantity demanded decreases.
- Excess supply (surplus) arises.
- The government may have to purchase the surplus stock.
17. What is the maximum price ceiling? Explain it implications.
Answer – Maximum Price Ceiling is the highest price fixed by the government, generally below the equilibrium price, to protect consumers from rising prices.
Implications:
- It keeps the price lower than the market equilibrium price.
- Quantity demanded exceeds quantity supplied.
- Shortage of the commodity arises.
- Black marketing and rationing may occur.
- Consumers benefit from lower prices, but producers may reduce supply.
18. What is the minimum price ceiling? Explain its implication.
Answer – Minimum Price Ceiling refers to the minimum price fixed by the government below which a commodity cannot be sold.
Implications:
- It is generally fixed above the equilibrium price.
- It creates excess supply (surplus) in the market.
- The government may purchase the surplus stock.
19. Explain the chain effects, if the prevailing market price is below the equilibrium price.
Answer – When market price is below the equilibrium price:
- Quantity demanded becomes greater than quantity supplied.
- Excess demand (shortage) occurs.
- Buyers compete with each other.
- Price starts rising.
- Market reaches equilibrium again.
20. If the prevailing market price is above the equilibrium price, explain its chain of effects.
Answer – When market price is above the equilibrium price:
- Quantity supplied becomes greater than quantity demanded.
- Excess supply (surplus) occurs.
- Sellers reduce the price to clear their stock.
- Quantity supplied falls and demand rises.
- New equilibrium is established.
21. Explain the chain of effects of an ‘increase’ in demand for a good.
Answer – An increase in demand causes:
- Rightward shift of the demand curve.
- Excess demand arises at the existing price.
- Price increases.
- Producers increase supply.
- New equilibrium is established.
22. Suppose the demand and supply equations of a commodity X in a perfectly competitive market are given by: Qd = 1700 – 2P; and Qs = 1300 + 3P. Calculate the value of equilibrium price and equilibrium quantity of the commodity X.
Answer –
Given:
Qd = 1700 – 2P
Qs = 1300 + 3P
At equilibrium:
Qd = Qs
1700 – 2P = 1300 + 3P
400 = 5P
P = 80
Equilibrium Price = ₹80
Equilibrium Quantity:
Qd = 1700 – 2(80)
= 1700 – 160
= 1540 units
Equilibrium Quantity = 1540 units
23. The market for a good is in equilibrium. How would an increase in an input price affect the equilibrium price and equilibrium quantity, ‘keeping other factors constant? Explain using a diagram.
Answer – An increase in input price raises the cost of production.
Effects:
- Supply decreases.
- Supply curve shifts leftward.
- Equilibrium price increases.
- Equilibrium quantity decreases.
24. The market for a good is in equilibrium. Explain, using a diagram, how an improvement in technology for producing the good would affect the equilibrium price and equilibrium quantity, keeping other factors constant.
Answer – Improvement in technology reduces the cost of production.
Effects:
- Supply increases.
- Supply curve shifts rightward.
- Equilibrium price decreases.
- Equilibrium quantity increases.
25. What is meant by ‘Price Floor’? Explain using a suitable example.
Answer – Price Floor is the minimum price fixed by the government above the equilibrium price to protect producers.
Example: Minimum Support Price (MSP) fixed for agricultural products.
Long Answer Type Questions
- How is equilibrium price of commodity determined? Explain with the help of a demand & Supply schedule.
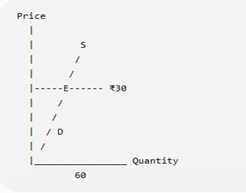
Answer: The equilibrium price of a commodity is determined by the interaction of market demand and market supply. The price at which quantity demanded is equal to quantity supplied is called the equilibrium price. At this price, there is neither excess demand nor excess supply in the market.
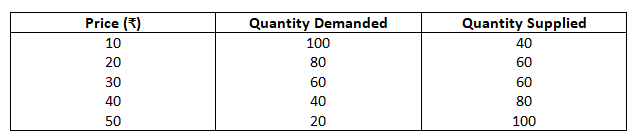
Demand and Supply Schedule:
From the above schedule:
- At ₹10 and ₹20, quantity demanded is greater than quantity supplied, creating excess demand.
- At ₹40 and ₹50, quantity supplied is greater than quantity demanded, creating excess supply.
- At ₹30, quantity demanded equals quantity supplied (60 units).
Equilibrium Price = ₹30
Equilibrium Quantity = 60 units
2. If at a given price of a commodity, there is excess demand, how will the equilibrium price be reached? Explain by diagram.
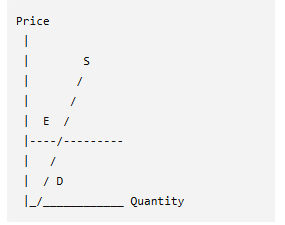
Answer: Excess demand occurs when the quantity demanded of a commodity is greater than its quantity supplied at the prevailing price.
Chain of Effects:
- Suppose the market price is below the equilibrium price.
- At this price, buyers demand more quantity than sellers are willing to supply.
- This creates a shortage of the commodity.
- Buyers compete with each other to purchase the commodity.
- Sellers increase the price due to higher demand.
- As price rises, quantity demanded decreases and quantity supplied increases.
- This process continues until quantity demanded becomes equal to quantity supplied.
3. If there is excess supply at a given price, then how will the equilibrium price be reached? Explain by diagram.
Answer: Excess supply occurs when quantity supplied is greater than quantity demanded at the prevailing price.
Chain of Effects:
- Suppose the market price is above the equilibrium price.
- At this price, producers supply more than consumers demand.
- This creates surplus stock in the market.
- Sellers compete with each other to sell their goods.
- They reduce the price to increase sales.
- As price falls, demand increases and supply decreases.
- The process continues until quantity demanded equals quantity supplied.
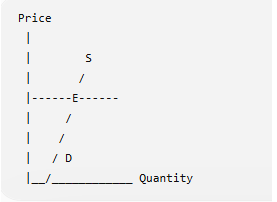
4. Explain with the help of a diagram the effect of a rightward shift of the supply curve of a commodity on its equilibrium price and quantity.
Answer: A rightward shift of the supply curve indicates an increase in supply of a commodity due to factors like improvement in technology, reduction in input prices, or government subsidy.
Effects:
- Supply curve shifts from S₁ to S₂.
- At the existing price, supply becomes greater than demand.
- Excess supply arises in the market.
- Sellers reduce the price to increase sales.
- Lower price increases quantity demanded.
- A new equilibrium is established.
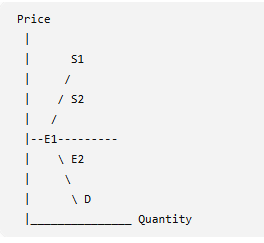
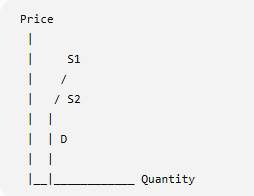
5. Discuss the effect of change in supply on equilibrium price and equilibrium quantity when demand is perfectly inelastic.
Answer: When demand is perfectly inelastic, the demand curve is vertical. It means that quantity demanded remains unchanged despite changes in price.
Case 1: Increase in Supply
- Supply curve shifts rightward.
- Excess supply occurs.
- Price falls.
- Quantity remains unchanged due to perfectly inelastic demand.
Case 2: Decrease in Supply
- Supply curve shifts leftward.
- Excess demand occurs.
- Price rises.
- Quantity remains unchanged.
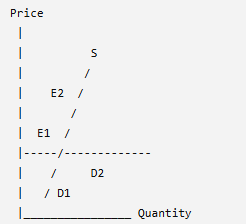
6. Market for a good is in equilibrium. There is an ‘increase’ in demand for this good. Explain the chain of effects of this change. Use diagram.
Answer: When the market is in equilibrium, an increase in demand causes a rightward shift of the demand curve.
Chain of Effects:
- Increase in demand shifts the demand curve from D₁ to D₂.
- At the existing price, quantity demanded becomes greater than quantity supplied.
- This creates excess demand in the market.
- Due to shortage, buyers compete with each other and price starts rising.
- Rise in price encourages producers to increase supply.
- A new equilibrium is established where demand equals supply.
Effects:
- Equilibrium price increases.
- Equilibrium quantity increases.
7. How is the equilibrium price and equilibrium quantity of a normal commodity affected by an increase in the income of its buyers? Explain with the help of a diagram.
Answer: A normal commodity is one whose demand increases when consumer income increases.
Chain of Effects:
- Increase in income of buyers increases demand for the commodity.
- Demand curve shifts rightward from D₁ to D₂.
- At the existing price, excess demand occurs.
- Price rises due to increased demand.
- Producers increase supply.
- New equilibrium is established.
Effect:
- Equilibrium price increases.
- Equilibrium quantity increases.
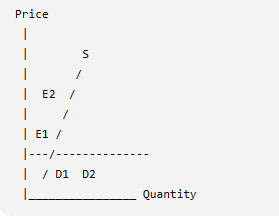
8. Explain the effect on equilibrium price and equilibrium quantity in the following cases:
- Demand curve shifts to the left;
- Supply increase when the demand is perfectly elastic;
- Both demand and supply increase in the same ratio.
Answer:
(a) Demand curve shifts to the left – A leftward shift of the demand curve indicates a decrease in demand.
Effects:
- Excess supply is created at the existing price.
- Sellers reduce the price.
- Quantity supplied decreases.
(b) Supply increases when demand is perfectly elastic – When demand is perfectly elastic, the demand curve is horizontal.
Effects:
- Increase in supply increases equilibrium quantity.
- Equilibrium price remains unchanged.
(c) Both demand and supply increase in the same ratio – When demand and supply increase in the same proportion:
- Both demand and supply curves shift rightward equally.
- Equilibrium quantity increases.
- Effect on equilibrium price depends on the relative changes in demand and supply.
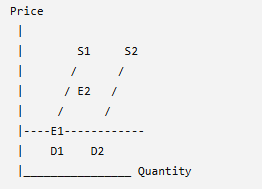
9. Market for a good is in equilibrium. What is the effect on equilibrium price and quantity if both market demand and market supply of the good increase in the same proportion? Use diagram.
Answer: When both market demand and market supply increase in the same proportion:
Chain of Effects:
- Demand curve shifts rightward.
- Supply curve also shifts rightward.
- Both changes take place equally.
- New equilibrium is formed at a higher quantity.
- Price remains unchanged.
Effect:
- Equilibrium quantity increases.
- Equilibrium price remains unchanged.
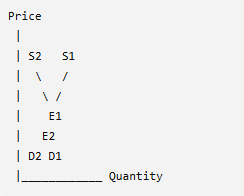
10. There is a simultaneous ‘decrease’ in demand and supply of a commodity. When will it result in: (a) No change in equilibrium price; (b) A fall in equilibrium price. Use diagram.
Answer:
(a) No change in equilibrium price – When decrease in demand and decrease in supply are equal in proportion:
- Demand curve shifts leftward.
- Supply curve also shifts leftward by the same amount.
- Both effects on price cancel each other.
(b) A fall in equilibrium price – A fall in equilibrium price occurs when:
- Decrease in demand is greater than decrease in supply.
- Leftward shift of demand curve is more than supply curve.
11. When will (a) simultaneous increase and (b) simultaneous decrease in both demand and supply not affect the equilibrium price? Explain with the help of diagrams.
Answer: Equilibrium price remains unchanged when the change in demand and supply takes place in the same proportion.
(a) Simultaneous Increase in Demand and Supply
- Demand curve shifts rightward from D₁ to D₂.
- Supply curve also shifts rightward from S₁ to S₂.
- The increase in demand raises the price, while increase in supply reduces the price.
- Both effects cancel each other.
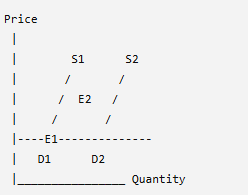
(b) Simultaneous Decrease in Demand and Supply
- Demand curve shifts leftward.
- Supply curve also shifts leftward equally.
- Decrease in demand reduces price, while decrease in supply raises price.
- Both effects cancel each other.
12. Market for a product is in equilibrium. Demand for the product ‘decreases’. Explain the chain of effects of this change till the market again reaches equilibrium. Use diagram.
Answer: A decrease in demand causes a leftward shift of the demand curve.
Chain of Effects:
- Demand curve shifts from D₁ to D₂.
- At the existing price, quantity supplied becomes greater than quantity demanded.
- Excess supply (surplus) arises.
- Sellers reduce the price to clear excess stock.
- Due to fall in price, demand increases and supply decreases.
- A new equilibrium is established.
Effect:
- Equilibrium price decreases.
- Equilibrium quantity decreases.
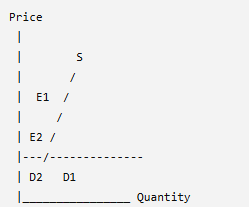
13. If the demand and supply of a commodity both increase, the equilibrium price may not change, may increase, may decrease.” Explain by using diagrams.
Answer: When both demand and supply increase, the effect on equilibrium price depends upon the relative increase in demand and supply.
(i) Equilibrium Price Remains Unchanged
- Demand and supply increase by the same proportion.
- Price remains constant.
- Quantity increases.
(ii) Equilibrium Price Increases
- Demand curve shifts more than supply curve.
- Excess demand arises.
- Price increases.
(iii) Equilibrium Price Decreases
- Supply curve shifts more than demand curve.
- Excess supply arises.
- Price decreases.
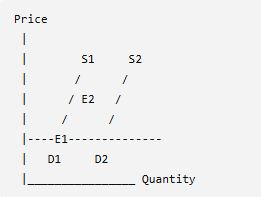
14. How is the equilibrium price of a good determined? Explain with the help of diagram a situation when both demand and supply curves shift to the right but equilibrium price remains the same.
Answer: The equilibrium price of a good is determined by the interaction of market demand and market supply. It is the price at which quantity demanded equals quantity supplied.
When both demand and supply curves shift to the right:
- Demand increases due to factors such as increase in income or population.
- Supply increases due to improvement in technology or reduction in input prices.
- If both increase equally, the increase in demand and supply cancels each other’s effect on price.
15. Suppose there is a sudden increase in the birth rate. The increase in population has raised the demand for shirts. At the same time, due to the fall in the price of cotton, the supply of shirts have also increased. How will it affect the equilibrium price and equilibrium quantity of shirts?
Answer: The increase in birth rate increases the population, which raises the demand for shirts. At the same time, fall in the price of cotton reduces the cost of production and increases the supply of shirts.
Effects:
- Demand curve shifts rightward.
- Supply curve also shifts rightward.
- Equilibrium quantity definitely increases.
- Effect on equilibrium price depends upon the relative increase in demand and supply.
If both increase equally:
- Equilibrium price remains unchanged.
If demand increases more:
- Equilibrium price rises.
If supply increases more:
- Equilibrium price falls.
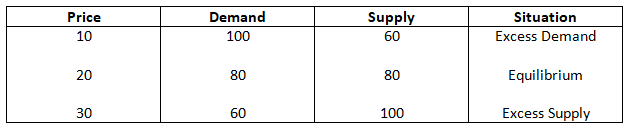
16. Explain the meaning of excess demand and excess supply with the help of a schedule. Explain their effect on equilibrium price.
Answer: Excess Demand – Excess demand occurs when quantity demanded is greater than quantity supplied at a given price.
Schedule:
Effect of Excess Demand:
- Shortage occurs in the market.
- Buyers compete for goods.
- Price increases.
- Equilibrium is restored.
Excess Supply – Excess supply occurs when quantity supplied is greater than quantity demanded at a given price.
Effect of Excess Supply:
- Surplus stock accumulates.
- Sellers reduce prices.
- Demand increases and supply decreases.
- Equilibrium price is restored.
17. Market for a good is in equilibrium. Explain the chain of reactions in the market if the price is: (i) higher than the equilibrium price; and (ii) lower than the equilibrium price.
Answer: Market equilibrium is a situation where quantity demanded is equal to quantity supplied at a particular price. This price is known as the equilibrium price.
(i) When price is higher than the equilibrium price: When the market price is fixed above the equilibrium price, quantity supplied becomes greater than quantity demanded. This creates a situation of excess supply or surplus in the market.
The chain of reactions is as follows:
- At a higher price, producers are willing to supply more goods, whereas consumers demand less.
- As a result, there is excess supply in the market.
- Sellers are unable to sell their entire stock.
- To clear their unsold stock, sellers start reducing the price.
- Fall in price increases quantity demanded and decreases quantity supplied.
- This process continues until quantity demanded becomes equal to quantity supplied.
(ii) When price is lower than the equilibrium price: When the market price is below the equilibrium price, quantity demanded becomes greater than quantity supplied. This creates a situation of excess demand or shortage.
The chain of reactions is:
- At a lower price, consumers demand more goods, while producers supply less.
- Due to excess demand, buyers compete with each other to purchase the limited supply.
- Sellers increase the price of the commodity.
- Rise in price reduces quantity demanded and increases quantity supplied.
- This process continues until the market reaches equilibrium.
18. Market for a good is in equilibrium. There is a simultaneous” both in demand and supply, but there is no change in price. Explain how it is possible. Use a schedule.
Answer: Equilibrium price is determined by the interaction of demand and supply. A simultaneous increase in demand and supply may result in no change in equilibrium price if both increase in the same proportion.
In such a situation, equilibrium quantity increases, but equilibrium price remains unchanged.
Schedule:
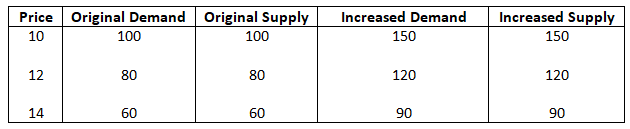
Initially, equilibrium exists at ₹10 where demand and supply are equal at 100 units.
After an increase in demand and supply, both curves shift rightward. At the new equilibrium, demand and supply increase to 150 units, but the price remains ₹10.
19. Discuss the concept of “Price Ceiling” with the help of a diagram.
Answer: Price Ceiling refers to the maximum price fixed by the government for a commodity below the equilibrium price. Producers are not allowed to charge a price higher than the price ceiling. The main objective of imposing a price ceiling is to protect consumers from high prices of essential goods.
Effects of Price Ceiling:
- Price ceiling creates a situation where quantity demanded becomes greater than quantity supplied.
- This leads to excess demand or shortage in the market.
- Since price cannot rise above the ceiling price, shortage continues.
- The government may introduce rationing to distribute the limited supply among consumers.
Example:
Government may fix a maximum price for essential commodities like food grains or medicines to make them affordable for consumers.
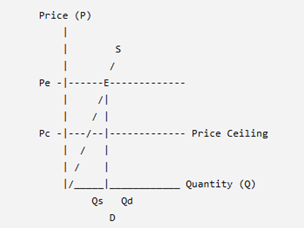
Explanation:
- Demand curve slopes downward.
- Supply curve slopes upward.
- Equilibrium price is determined where demand and supply curves intersect.
- Price ceiling is fixed below the equilibrium price, creating excess demand.
20. If the equilibrium price of a good is greater than its market price, explain all the changes that will take place in the market. Use diagram.
Answer: When the equilibrium price is greater than the market price, it means that the prevailing market price is below the equilibrium price.
At this lower price:
- Quantity demanded becomes greater than quantity supplied.
- This creates a situation of excess demand or shortage in the market.
- Consumers compete with each other to purchase the limited quantity available.
- Sellers realise that consumers are willing to pay a higher price.
- As a result, market price starts increasing.
- Increase in price reduces demand and encourages producers to increase supply.
- The price continues to rise until quantity demanded becomes equal to quantity supplied.
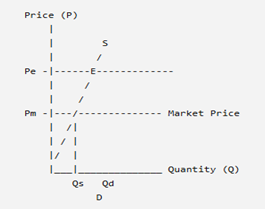
Explanation:
- The demand curve (DD) slopes downward.
- Supply curve (SS) slopes upward.
- Market price below equilibrium price creates excess demand.
- The rise in price brings the market back to equilibrium.
21. Market for a good is in equilibrium. Due to some technical innovations, the production technology of the goods has improved. Explain the likely effect of this change on equilibrium price and equilibrium quantity of the good.
Answer: Technological improvement increases the efficiency of production and reduces the cost of producing goods. As a result, producers are able to supply more goods at the same price.
Effects on Market Equilibrium:
- Improvement in production technology leads to an increase in supply of the commodity.
- The supply curve shifts rightward.
- Due to an increase in supply, there is excess supply at the existing equilibrium price.
- Sellers reduce the price to clear the surplus stock.
- Fall in price increases quantity demanded.
- The market reaches a new equilibrium at a lower equilibrium price and higher equilibrium quantity.
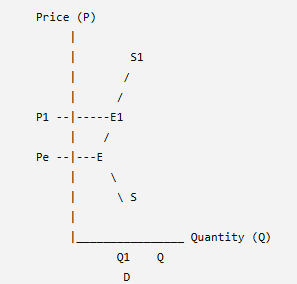
22. Market for a product is in equilibrium. Supply of the product ‘decreases’. Explain the chain of effects of this change till the market again reaches equilibrium. Use diagram.
Answer: Market equilibrium is a situation where quantity demanded is equal to quantity supplied at a particular price. When the supply of a product decreases due to reasons such as increase in input prices, higher taxes, or reduction in the number of producers, the supply curve shifts towards the left.
Chain of Effects:
- Decrease in supply shifts the supply curve from SS to S₁S₁.
- At the existing equilibrium price, quantity supplied becomes less than quantity demanded.
- This creates a situation of excess demand or shortage in the market.
- Due to shortage, buyers compete with each other to purchase the available quantity.
- Sellers increase the price of the commodity.
- Rise in price reduces quantity demanded and increases quantity supplied.
- The market reaches a new equilibrium where demand and supply become equal again.
Effect on Equilibrium:
- Equilibrium price increases.
- Equilibrium quantity decreases.
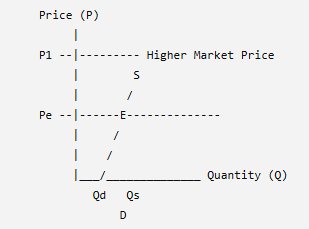
23. Explain the changes that will take place in the market when market price of a good is greater than is equilibrium price. Use diagram.
Answer: Equilibrium price is the price at which quantity demanded is equal to quantity supplied. When the market price is greater than the equilibrium price, it creates an imbalance in the market.
Chain of Effects:
- At a price higher than equilibrium price, producers supply more goods while consumers demand less.
- This results in excess supply or surplus in the market.
- Sellers are unable to sell their entire stock.
- To clear their unsold stock, sellers start reducing the price.
- Fall in price increases quantity demanded and decreases quantity supplied.
- The process continues until quantity demanded becomes equal to quantity supplied.
- The market again reaches equilibrium.
Effect:
- Market price falls.
- Quantity demanded increases.
- Quantity supplied decreases.
24. The market for commodity A is equilibrium. The price of its inputs rises. Explain its chain of effects on equilibrium price, quantity demanded and supplied with the help of a diagram.
Answer: The price of inputs is an important determinant of supply. When the price of inputs rises, the cost of production increases, which reduces the profitability of producers.
Chain of Effects:
- Increase in input prices raises the cost of production.
- Producers reduce the supply of commodity A.
- Supply curve shifts leftward from SS to S₁S₁.
- At the existing price, demand becomes greater than supply.
- Shortage occurs in the market.
- Due to shortage, price of the commodity increases.
- Higher price reduces quantity demanded and encourages producers to increase supply.
- New equilibrium is established.
Effect on Market Equilibrium:
- Equilibrium price increases.
- Equilibrium quantity decreases.
- Quantity demanded and quantity supplied become equal at the new equilibrium point.
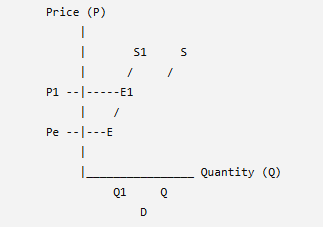
25. Good Y is a substitute for good X. The price of Y falls. Explain the chain of effects of this change in the market of X.
Answer: Substitute goods are those goods which can be used in place of each other. For example, tea and coffee are substitute goods. When the price of good Y falls, consumers prefer more of Y because it becomes relatively cheaper.
Chain of Effects on Market of X:
- Price of substitute good Y decreases.
- Consumers shift their demand from good X to good Y.
- Demand for good X decreases.
- The demand curve of X shifts leftward from DD to D₁D₁.
- At the existing equilibrium price, supply becomes greater than demand.
- This creates excess supply in the market.
- Sellers reduce the price of X to clear their unsold stock.
- Fall in price increases quantity demanded and reduces quantity supplied.
- New equilibrium is established.
Effect on Good X:
- Equilibrium price of X decreases.
- Equilibrium quantity of X decreases.
26. X and Y are complementary goods. The price of Y falls. Explain the chain of effects of this change in the market of X.
Answer: Complementary goods are those goods which are used together to satisfy a particular want. A change in the price of one complementary good affects the demand for the other good.
Example, car and petrol, pen and ink are complementary goods.
Chain of Effects:
- A fall in the price of good Y makes it cheaper for consumers.
- Consumers increase their consumption of good Y.
- Since X and Y are complementary goods, the demand for good X also increases.
- The demand curve of X shifts towards the right from DD to D₁D₁.
- At the existing equilibrium price, demand becomes greater than supply, creating excess demand.
- Due to shortage in the market, sellers increase the price of good X.
- Rise in price reduces quantity demanded and encourages producers to increase supply.
- A new equilibrium is established where quantity demanded becomes equal to quantity supplied.
Effect on Market of X:
- Equilibrium price of X increases.
- Equilibrium quantity of X increases.
27. Define Price Floor. What is the common purpose of fixation of price floor by the government? Explain any one likely consequence of this nature of intervention by the government.
Answer:
Price Floor: Price Floor refers to the minimum price fixed by the government for a commodity above the equilibrium price. Producers are not allowed to sell the commodity below this fixed minimum price. The main objective of imposing a price floor is to protect the interests of producers, especially farmers, by ensuring them a minimum income.
Purpose of Price Floor:
The government fixes a price floor to:
- Provide fair remuneration to producers.
- Protect producers from a sharp fall in market prices.
- Encourage production of essential goods.
Example: Minimum Support Price (MSP) fixed for agricultural products.
One Likely Consequence:
A price floor fixed above equilibrium price creates a situation of excess supply.
The reason is:
- At a higher price, producers supply more goods.
- Consumers demand less quantity.
- As a result, quantity supplied becomes greater than quantity demanded.
- This creates surplus stock in the market.
28. Define Price Ceiling. What is the common purpose for the price ceiling imposed by the government? Explain any one likely consequence of this nature of intervention by the government in the price determination process.
Answer:
Price Ceiling: Price Ceiling refers to the maximum price fixed by the government for a commodity below the equilibrium price. Sellers cannot charge a price higher than the price ceiling.
Purpose of Price Ceiling:
The government imposes price ceilings to:
- Protect consumers from high prices.
- Make essential goods affordable for weaker sections of society.
- Control prices of necessary commodities.
Example: Price control on essential medicines or food items.
One Likely Consequence: A price ceiling fixed below equilibrium price leads to excess demand or shortage in the market.
The reason is:
- Lower price increases quantity demanded by consumers.
- Producers supply less quantity at this lower price.
- Quantity demanded becomes greater than quantity supplied.
- This creates a shortage in the market.
- Government may introduce rationing to distribute limited supply.