Introduction
Demand is the quantity of a commodity that a consumer is willing and able to buy at, each possible price during a given period of time.
The definition of demand highlights four essential elements of demand:
- Quantity of the commodity
- Willingness to buy
- Price of the commodity
- Period of time
Demand for a commodity may be either with respect to an individual or to the entire market.
- Individual demand – Individual demand refers to the quantity of a commodity that a consumer is willing and able to buy, at each possible price during a given period of time.
- Market demand – Market demand refers to the quantity of a commodity that all consumers are willing and able to buy, at each possible price during a given period of time.
Determinants of Demand (Individual Demand)
- Price of the Given Commodity – It is the most important factor affecting demand for the given commodity. Generally, there exists an inverse relationship between price and quantity demanded. It means that as price increases, quantity demanded falls due to a decrease in the satisfaction level of consumers. For example – It price of given commodity (say, tea) increases, its quantity demanded will fall as satisfaction derived from tea will fall due to rise in its price.
- Price of Related Goods – Related goods are the goods in which change in price of one good (say, x) causes a change in the demand for other good (say, y). Demand for the given commodity is also affected by changes in prices of the related goods.
- Substitute Goods – Substitute goods are those goods which can be used in place of one another for the satisfaction of a particular want, like tea and coffee.
- Complementary Goods – Complementary goods are those goods which are used together to satisfy a particular want, like tea and sugar.
3. Income of the Consumer – Demand for a commodity is also affected by income of the consumer. However, the effect of change in income on demand depends on the nature of the commodity under consideration.
4. Tastes and Preferences – Tastes and preferences of the consumer directly influence the demand for a commodity. They include changes in fashion, customs, habit, etc.
5. Expectation of Change in the Price in Future – If the price of a certain commodity is expected to increase in the near future, then people will buy more of that commodity than what they normally buy.
Change in Quantity Demanded Vs Change in Demand
- Change in Quantity Demanded – Quantity demanded refers to a specific quantity to be purchased against the specific price of the commodity. Whenever demand for a given commodity changes due to a change in its own price, then such change in demand is known as “Quantity Demanded “. For example if demand for Pepsi changes due to change in its own price, then such change in demand for Pepsin is known as change in quantity demanded.
- Change in Demand – Whenever demand for the given commodity changes due to factors other than price, then such change in demand is known as “Change in Demand”. For Example – if demand for Pepsi change due to a change in the price of Coke or due to change in income or due to a change in taste, then such change in demand for Pepsi is known as change in demand.
Determinants of Market Demand
Market demand is influenced by all the factors affecting individual demand for a commodity. In additional, it is also affected by the following factors:
- Size and composition of population – Market demand for a commodity is affected by size of population in the country. An increase in population raises the market demand, while a decrease in population reduces the market demand.
- Season and Weather – The seasonal an weather conditions also affect the market demand for a commodity. For example – during demand for woolen clothes & jackets increases, whereas, market demand for raincoats and umbrellas increase during the rainy season.
- Distribution of Income – If income in the country is equitably distributed, them market demand for commodities will be higher. However, if income distribution is uneven, i.e. people are either very rich or very poor, then market demand will remain at a lower level.
Demand Function
Demand function shows the relationship between quantity demanded for a particular commodity and the factors influencing it. It can be either with respect to one consumer (individual demand function) or to all the consumers in the market (market demand function).
Individual Demand Function – Individual demand function refers to the function relationship between individual demand and the factors affecting individual demand.
It is expressed as: Dx = f (Px, Pr, Y, T, F)
Market Demand Function – Market demand function refers to the functional relationship between market demand and the factors affecting market demand.
As mentioned before market demand is affected by all factors affecting individual demand. In addition, it is also affected by size and composition of population, season and weather and distribution of income.
So, market demand function can be expressed as: Dx = f (Px, Pr, Y, T, F, Po, S, D)
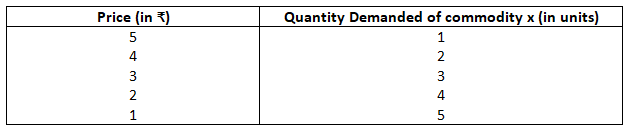
Demand Schedule – Demand schedule is a tabular statement showing various quantities of a commodity being demanded at various levels of price, during a given period of time. It shows the relationship between price of the commodity and its quantity demanded.
A demand schedule can be determined both for individual buyers and for the entire market. So, demand schedule is of two types:
- Individual Demand Schedule
- Market demand schedule
Individual Demand Schedule – Individual demand schedule refers to a tabular statement showing various quantity of a commodity that a consumer is willing to buy at various levels of price, during a given period of time.
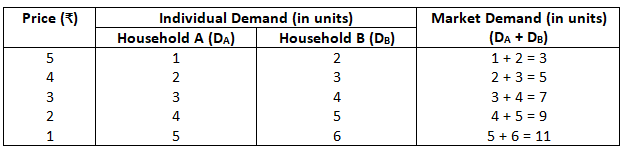
Market demand schedule – Market demand schedule refers to a tabular statement showing quantities of a commodity that all the consumer are willing to buy at various levels of price, during a given period of time.
Demand curve – Demand curve is a graphical representation of demand schedule. It is the locus of all the points showing various quantities of a commodity that a consumer is willing to buy at various levels of price, during a given period of time, assuming no change in other factors.
- It shows the inverse relationship between the quantity demanded of a commodity and its price, keeping other factors constant.
- It can be drawn for any commodity by plotting each combination of demand schedules on a graph.
- Like demand schedules, demand curves can also be drawn both for individual buyers and for the entire market. So, the demand curve is of two types:
- Individual Demand curve
- Market Demand Curve
Individual Demand Curve – Individual demand curve refers to a graphical representation of individual demand schedule.
Market Demand Curve – Market demand curve refers to a graphical representation of market demand schedule.
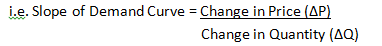
Slope of Demand Curve – Slope of a curve is defined as the change in the variable on the Y-axis divided by the change in the variable on the X-axis. So, the slope of the Demand curve equals in Price divided by the Change in Quantity.
- Due to inverse relationship between price and demand, the demand curve slopes downwards. So, slope is Negative.
- Slope of the demand curve measure its flatness or steepness. So, it is based on the absolute change in price and quantity.
Law of Demand – In our daily life, it is normally observed that decrease in price of a commodity leads to increase in its demand. Such behaviour of consumer has been formulated as ‘Law of Demand’. Law of demand states the inverse relationship between price and quantity demanded, keeping other factors constant (ceteris paribus). This law is also known as ‘First Law of Purchase’.
Assumptions of Law of Demand – while stating the law of demand, we use the phrase ‘keeping other factor constant or ceteris paribus’. This phrase is used to cover the following assumption on which the law is based:
- Prices of substitute goods remain constant.
- Prices of complementary goods remain constant.
- Income of the consumer remains the same.
- There is no expectation of a change in price in the future.
- Tastes and preferences of the consumer remain the same.
Important Facts about Law of Demand
- Inverse Relationship – It states the inverse relationship between price and quantity demanded. It simply affirms that an increase in price will tend to reduce the quantity demanded and a fall in price will lead to an increase in the quantity demanded.
- Qualitative, not Quantitative – It makes a qualitative statement only, i.e. it indicates the direction of change in the amount demanded and does not indicate the magnitude of change.
- No proportional relationship – it does not establish any proportional relationship between a change in price and the resultant change in demand. If the price rises by 10%, the quantity demanded may fall by any proportion.
- One-Sided – Law of demand is one-sided as it only explains the effect of a change in price on the quantity demanded. It states nothing about the effect of change in quantity demanded on the price of the commodity.
Derivation of ‘Law of Demand’ – This inverse relationship between price and demand as given by Law of demand, can be derived by: (i) Marginal Utility = Price Condition, and (ii) Law of Equi-Marginal Utility. Let us discuss the two in detail:
i. Marginal Utility = Price (Single commodity Equilibrium Condition) – According to the single commodity equilibrium condition, the consumer purchase that much quantity of a good at which marginal utility (MU) is equal to price.
When MU is more than Price: – If Price of the good falls, MU becomes greater than price. This encourages the consumer to buy more. It shows that when the price of a good falls, its demand rises.
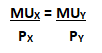
ii. Law of Equi-Marginal Utility – According to this law, a consumer will be at equilibrium when he spends his limited income in such a way that the ration of marginal utilities and their respective prices are equal and MU falls as consumption increase. In case of two goods (say, X and Y), equilibrium condition will be stated as:
Reasons of Law of Demand
- Law of Diminishing Marginal Utility – Law of diminishing marginal utility states that as we consume more and more units of a commodity, the utility derived from each successive unit goes on decreasing. So, demand for a commodity depends on its utility. If the consumer gets more satisfaction, he will pay more. As a result, consumers will not be prepared to pay the same price for additional units of the commodity. The consumer will buy more units of the commodity only when the price falls.
- Substitution Effects – Substitution effect refers to substituting one commodity in place of other when it becomes relatively cheaper. When the price of the given commodity falls, it becomes relatively cheaper as compared to its substitute (assuming no change in the price of substitute). As a result, demand for the given commodity rises. For example – If Price of given commodity (say, Pepsi falls, with no change in price of its substitute (say, Coke), then Pepsi will become relatively cheaper and will be substituted for coke, i.e. demand for Pepsi will rise.
- Income Effect – Income effect refers to effect on demand when real income of the consumer changes due to a change in the price of the given commodity. When the price of the given commodity falls, it increases the purchasing power (real income) of the consumer. As a result, he can purchase more of the given commodity with the same money income. For example – suppose Isha buys 4 chocolates @ Rs.10 each with her pocket money of Rs.40. If the price of chocolate falls to Rs.8 each, then with the same money income, Isha can buy 5 chocolate due to an increase in her real income.
- Additional customer – When the price of a commodity falls, many new consumer, who were not in a position to buy it earlier due to its high price, start purchasing it. In addition to new customers, old consumers of the commodity start demanded more due to its reduced price. For example – If price of ice-cream family pack falls from Rs.150 to Rs.100 per pack, then many consumers who were not in a position to afford the ice-cream earlier can now buy it with decrease in its price. Moreover, the old customers of ice-cream can now consume more. As a result, its total demand increases.
- Different Uses – Some commodities like mile, electricity, etc., have several uses, some of which are more important than the others. When the price of such a good (say, milk) increases, its uses get restricted to the most important purpose (say, drinking) and demand for less important uses (like cheese, butter, etc.) gets reduced. However, when the price of such a commodity decreases, the commodity is put to all its uses, whether important or not.
Exceptions to Law of Demand – As a general rule, demand curve slopes downwards, showing the inverse relationship between price and quantity demanded. However, in certain special circumstances, the reverses may occur, i.e. a rise in price may increase the demand. These circumstances are known as ‘Exceptions to the low of Demand’.
Some of the important Exceptions are:
- Geffen Goods – These are special kinds of inferior goods on which the consumer spends a large part of his income and their demand rises with an increase in price and demand falls with a decrease in price. For example – in our country, it is often seen that when the price of coarse cereals like jowar and bajra falls, the consumers have a tendency to spend less on them and shift over to superior cereals like wheat and rice. This phenomenon, popularly known as “Giffen’s Paradox’, was first observed by Sir Robert Giffen.
- Status Symbol Goods or Goods of Ostentation – the exception relates to certain prestige goods which are used as status symbols. For example – diamonds, gold antique paintings, etc. are bought due to the prestige they confer upon the possessor. Such goods are demanded only because their prices are very high. If their prices fall, they will no longer be considered as statues symbol goods and their demand will decrease.
- Fear of Shortage – If the consumers expect a shortage or scarcity of a particular commodity in the near future, then they will start buying more and more of that commodity in the current period even if their prices are rising. The consumers demand more due to fear of further rise in prices. For example – during emergencies like war, famines, etc., consumers demand goods even at higher prices due to fear of shortage and general insecurity.
- Ignorance – consumers may buy more of a commodity at a higher price when they are ignorant of the prevailing prices of the commodity in the market.
- Fashion related goods – Goods related to fashion do not follow the law of demand and their demand increase even with a price in their prices. For example – if any particular type of dress is in fashion, then demand for such does will increase even if its price is rising.
Movement Along the Demand Curve (change in quantity Demanded)
When quantity demanded of a commodity changes due to a change in its price, keeping other factors constant, it is known as change in quantity demanded. It is graphically expressed as a movement along the same demand curve. There can be either a downward movement (expansion in demand) or an upward movement (contraction in demand) along the same demand curve. Let us understand the movement along the demand curve
- Upward Movement – When price rises to OP2 quantity demanded falls to OQ2 (known as contraction in demand) leading to an upward movement from A to C along the same demand curve DD.
- Downward Movement – On the other hand, fall in price from OP to OP1 leads to an increase in quantity demanded from OQ to OQ1 (known as expansion in demand), resulting in a downward movement from A to B along the same demand curve DD.
Expansion in Demand – Expansion in demand refers to a rise in the quantity demanded due to a fall in the price of commodity, other factors remaining constant.
- It lease to a downward movement along the same demand curve.
- It is also known as ‘Extension in Demand’ or ‘Increase in Quantity Demanded’.
Contraction in Demand – Contraction in demand refers to a fall in the quantity demanded due to a rise in the price of commodity, other factors remaining constant.
- It leads to an upward movement along the same demand curve.
- It is also known as ‘Decrease in Quantity Demanded’.
Shift in Demand curve (Change in Demand) – Demand curve is drawn to show the relationship between price and quantity demanded of a commodity, assuming all other factors being constant. However, other factors are bound to change sooner or later. A change in one of ‘other factors’ shifts the demand curve. When the demand of a commodity change due to change in any factor other than the own price of the commodity, it is known as change in demand. It is expressed as a shift in the demand curve.
Various Reasons for Shift in Demand Curve
- Change in price of substitute goods;
- Change in price of complementary goods;
- Change in income of consumers;
- Change in tastes and preferences;
- Expectation of change in price in future;
- Change in distribution of income;
- Change in season and weather.
Increase in Demand – Increase in Demand refers to a rise in the demand of a commodity caused due to any factor other than the own price of the commodity. In this case, demand rises at the same price or demand remains same even at higher price.
Decrease in Demand – Decrease in Demand refers to a fall in the demand of a commodity caused due to any factor other than the own price of the commodity. In this case, demand falls at the same price or demand remains same even at lower price. It leads to a leftward shift in the demand curve.
Substitute Goods and Complementary Goods
Substitute Goods – Substitute goods are those goods which can be used in place of one another for satisfaction of a particular want, like tea and coffee.
Demand for a given commodity varies directly with the price of a substitute good. For example if price of a substitute good (say, coffee) increases, then demand for given commodity (say, tea) will rise as tea will become relatively cheaper in comparison to coffee.
Complementary Goods – Complementary goods are those goods which are used together to satisfy a particular want. Demand for a given commodity varies inversely with the price of a complementary good. For example – If price of a complementary goods (say, sugar) increases, then demand for given commodity (say, tea) will fall as it will be relatively costlier to use both the goods together.
Cross Demand – Cross demand refers to the relationship between the demand of a given commodity and the price of related commodities, other things remaining the same. Cross demand indicates how much quantity of a given commodity will be demanded at different prices of a related commodity (substitute or complementary).
It can be expressed as: DX = f (Py)
Cross Demand can be either Positive or Negative
- Cross demand is positive in case of substitute goods as demand for the given commodity varies directly with the prices of substitute goods.
- Cross demand is negative in case of complementary goods as demand for the given commodity varies inversely with the price of complementary goods.
Cross Price Effect on Demand Curve
Cross Price Effect refers to effect on the demand for a given commodity due to a change in the price of a related commodity.
Change in Prices of Substitute Goods – A change (increase or decrease) in the price of substitute directly affects the demand for a given commodity.
- Increase in Price of Substitute Goods – When price of substitute goods (say, coffee) rises, demand for the given commodity (say, tea) also rises from OQ to OQ1 at its same price of OP. It leads to a rightward shift in the demand curve of the given commodity from DD to D1D1.
- Decrease in Price of Substitute Goods – With decrease in price of substitute goods (coffee), demand for the given commodity (tea) also decreases from OQ to OQ1 at the same price of OP. It shift the demand curve of the given commodity towards left from DD to D1D1.
Normal Goods – Normal goods refer to those goods whose demand increases with an increase in income. For example – If the demand for TV increases with a rise in income, then TV will be called a normal good. Income effect is positive in case of normal goods.
Inferior Goods – Inferior goods refer to those goods whose demand decrease with an increase in income. It means, that there exists an inverse relationship between income and the demand for inferior goods. So, income effect is negative in case of inferior goods. It must be noted that inferior goods are generally purchased because they are essentials of life. For example – If the income of a consumer rises and he prefers to replace his black-and-white (B/W) TV with a coloured one, then demand for B/W TV will fall. In such case, B/W TV is an inferior good.
Effect on Demand Curve (with change in income) – A change in income causes a positive change in demand for normal goods, whereas, a negative change occurs in the case of inferior goods. So, the demand curve of a given commodity is affected by change in income in case of normal goods and inferior goods. It must be noted that there is no change in demand for the necessity goods with increase or decrease in income.
Change in income (Normal Goods) – A change (increase or decrease) in the income of consumer directly affects the demand for a given commodity.
- Increase in Income – As income rises, the demand for normal goods (say, TV) also rises from OQ to OQ1 at the same price of OP. It leads to a rightward shift in the demand curve of normal good from DD to D1D1.
- Decrease in Income – With fall in income, the demand for normal goods (TV) falls from OQ to OQ1 at the same price of OP. it shift the demand curve of normal good towards left from DD to D1D1.
Change in Income (Inferior Goods) – An increase or decrease in income affects the demand inversely, if the given commodity is an inferior good.
- Increase in Income – As income increases, the demand for inferior goods (say, black-and-white TV) falls from OQ to OQ1 at the same price of OP. It leads to a leftward shift in the demand curve of inferior good from DD to D1D1.
- Decrease in Income – As income decreases, the demand for inferior goods (say, black-and-white TV) rises from OQ to OQ1 at the same price of OP. It leads to a rightwards shift in the demand curve of inferior good from DD to D1D1.
Kinds of Demand –
- Price Demand – price demand for refers to relationship between the price demand of a commodity, assuming other factors are constant. It can be shown as Dx = f (Px, Where Dx = Demand for the given commodity; f = functional relationship; Px = Price of the given commodity.
- Income Demand – Income demand refers to a relationship between the income of a consumer and the quantity demanded of a commodity, assuming other factor are constant. Symbolically. Dx = f(Y); Where: Dx = Demand for the given commodity; f = functional relationship, Y = Income of the consumer.
- Cross Demand – Cross demand refers to a relationship between the demand for a given commodity and the prices of related commodities, assuming other things remain the same.
- Joint Demand – When two or more goods are demanded simultaneously to satisfy a particular want, then such a demand is called joint demand. For example – demand for sugar, mile, and tea leaves is a joint demand, as they are demanded together to prepare tea.
- Composite Demand – When a commodity can be put to several uses, its demand is known is composite demand. For example – demand for electricity is a composite demand as it can be used for various purpose like lighting rooms, running the refrigerator, TV, AC, etc.
- Derived Demand – Demand for a commodity which depends on the demand for other goods, is known as derived. For example – demand fro labour producing cloth is a derived demand as it depends on the demand for cloth.
- Direct Demand – When a commodity satisfies the wants directly, its demand is termed as direct demand. For example – demand for clothes, books, food is a direct demand as these items satisfy the wants directly.
- Alternative Demand – Demand is known as alternative demand, when in can be satisfied by different alternatives. For example – there are a number of options (alternatives) to satisfy the demand for food like chapatti, rice, salad, fruits, burger, pizza, etc.
- Competitive Demand – When two goods are close substitutes of each other and increase in demand for one of them will decrease the demand for the other, then the demand for any one for them is known as competitive demand. For example – increase in demand for coffee might reduce the demand for tea. It happens because purchase of more of one commodity (say, coffee) leads to a lesser requirement for the other commodity (say, tea).
Unsolved Practical’s
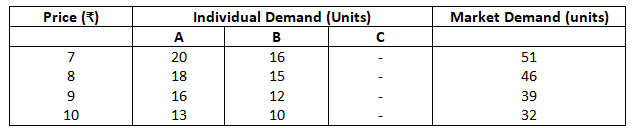
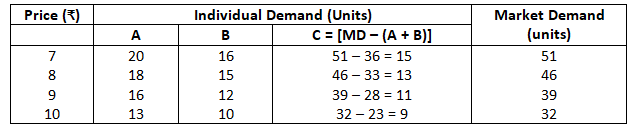
- From the following data regarding individual demand schedules of household A, B and market demand schedule, prepare the demand schedule of household C, assuming that there are only there households in the market.
Solution –
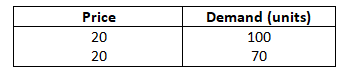
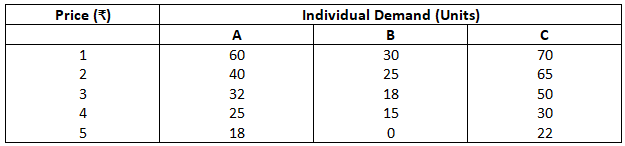
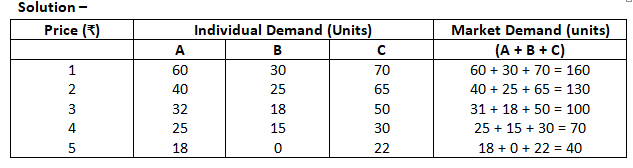
2. Suppose there are 3 consumers in a particular market: A, B and C. Their demand schedules are given in the following table. Prepare the market demand schedule.
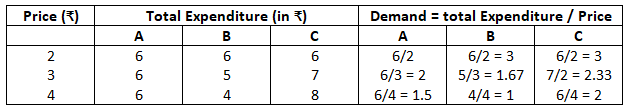
3. On the basis of information given in the following table, prepare the demand schedules for three commodities:
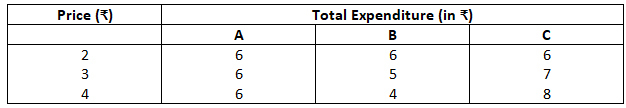
Solution –
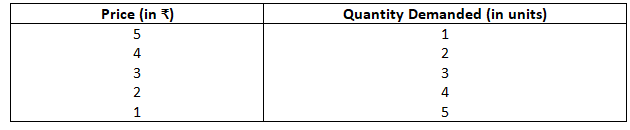
4. The demand function of a commodity x is given by Qx = 20 – 3Px. Find out the values of Px, when corresponding values of Qx are given as: 5, 8, 11 and 14.
Solution –
Given –
Qx = 20 – 30x
To find – Px When:
Qx = 5
5 = 20 – 3Px
3Px = 15
Px = 5
Qx = 8
8 = 20 – 3Px
3Px = 12
Px = 4
Qx = 11
11 = 20 – 3Px
3Px = 9
Px = 3
Qx = 14
14 = 20 = 3Px
3Px = 6
Px = 2